


")


 Tokens Playing This P2E Game")

Bitcoin continues to trade sideways at the April 10 Wall Street open, but many are betting on a potential impending breakout. Following a recent surge that led to BTC/USD’s highest weekly closure since June 2022, there is renewed confidence that Bitcoin may soon surpass the $30,000 mark.
Let’s see what’s going on in the Bitcoin and altcoins market this week.
A Volatile Week Ahead!
Over the past week (first week of April 2023), Bitcoin and altcoins have remained relatively stable. However, the SushiSwap hack added some drama to the crypto market, highlighting the industry’s frequency of hacks and exploits.
The second week of April promises to be eventful, with Wednesday being particularly busy as Ethereum completes its Shapella upgrade, allowing for ETH unstaking by validators.
Moreover, it coincides with the publication of the CPI for March and the Fed’s minutes from its March meeting. Additionally, the Chicago Mercantile Exchange (CME) will transition some of its futures contracts to a new interest rate on Friday.
The Aftermath?
The impact of ETH unstaking on the cryptocurrency market and ETH itself remains uncertain. One possible outcome is that the successful implementation of the Shapella upgrade could boost institutional investor confidence in ETH, resulting in increased buying and a rise in ETH’s value.
However, there is also the potential for significant sell pressure from unstaked ETH, which could lead to a sharp decline in ETH’s value. In fact, this initial sell pressure could amount to over $2 billion USD.
Moreover, there is a risk that the SEC might consider ETH a security after the upgrade. Former SEC director Bill Hinman previously deemed ETH as not a security due to its “sufficiently decentralized” nature; however, this determination was when ETH was still a proof-of-work asset.
Although it is still technically a proof-of-work asset, this could change once unstaking is allowed. Also, it’s worth noting that SEC Chairman Gary Gensler has stated that proof-of-stake cryptocurrencies are considered securities. Thus, there is a possibility that the SEC may reclassify ETH as a security, which could have significant implications for the crypto market.
What About the CPI?
Regarding the CPI print for March, the core CPI number, not just the headline number, will be crucial as it seems to be getting stuck at just over 5%. A crash could happen if either headline or core CPI stays the same or suddenly increases. Alternatively, a rally might occur if either headline or core CPI suddenly decreases.
Besides, the Fed’s minutes from the March meeting will reveal whether Fed officials are nervous about financial stability or still focused on inflation. It is particularly significant as the meeting occurred just days before the banking crisis began.
If the minutes indicate that officials are becoming increasingly nervous about financial stability, it could have a bullish effect. Conversely, if the focus remains primarily on inflation, it could have a bearish impact on the market.
Finally, the CME’s interest rate switch is also something to watch. As the world’s largest futures exchange, the CME will transition its futures contracts from the LIBOR rate to the SOFR rate starting Friday.
This change can cause market volatility, as noted by Fitch Ratings in 2021, and recent articles by the Financial Times suggest that this risk still exists. While we can only hope this transition will not result in a black swan event, it remains a concern.
Rising Volatility in the Price of Bitcoin
Traders looking for volatility will have plenty of it, as per data from market data resource Kaiko. Bitcoin’s volatility is diverging from that of equities, with increasing action while the Nasdaq cools. Last month’s events related to the U.S. banking crisis widened the gap between Bitcoin and Nasdaq 30-day rolling volatility, reaching the highest levels in a year.
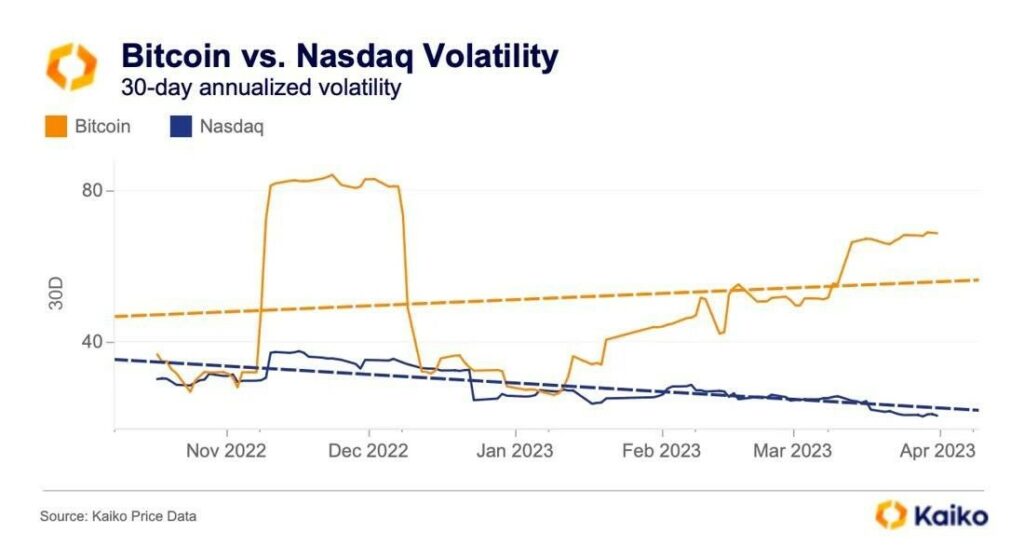
Source: Kaiko
Kaiko reported in the first week of April that Bitcoin’s correlation with gold had surpassed its correlation with the S&P 500. The gap is now even wider!
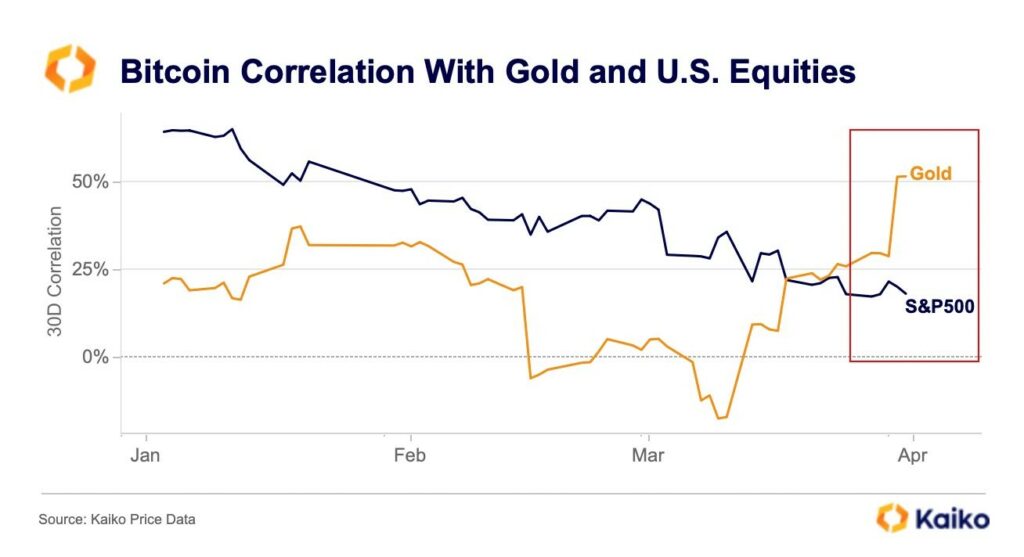
Source: Kaiko
Additionally, the market data resource noted that Bitcoin’s inverse correlation with the U.S. dollar is rapidly unwinding. While BTC is still negatively correlated with the U.S. dollar, the correlation has become almost negligible, dropping from -60% to -23% year-to-date.
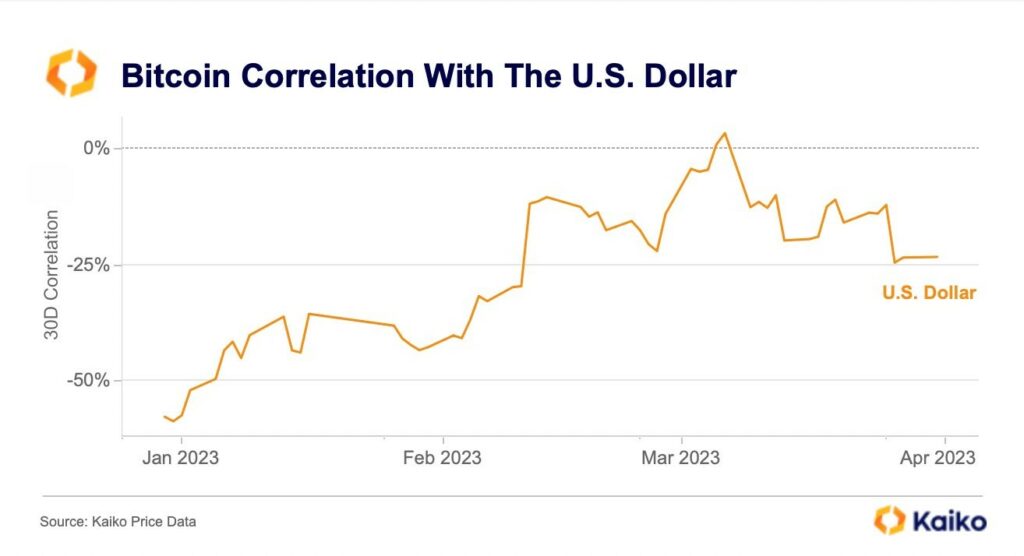
Source: Kaiko
These insights suggest that Bitcoin’s relationship with traditional markets is shifting, and the crypto continues to take on a more safe-haven asset role.
Bull Run: A Long Way Off?
During a price bottom, short-term holders typically benefit more, and the need for continued Bitcoin price growth depends on their behavior and profitability. Understanding the value held by Bitcoin holders based on realized price is a valuable way to determine their behavior.
On the other hand, long-term holders tend to hold their coins for extended periods and tolerate more loss.
Often, profitable days for Bitcoin begin with the profitability of the short-term holders. As their profits increase, they become more interested in retaining their coins, leading to less selling pressure. As a result, short-term holders are currently more valuable.
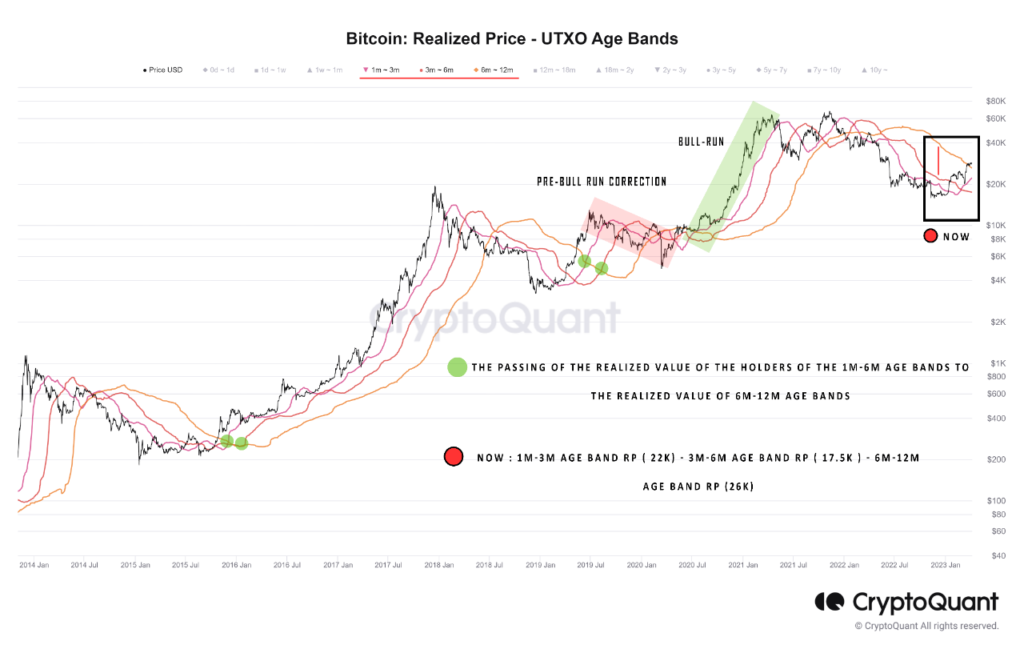
Source: CryptoQuant
According to the given metric, when the realized price of the 1-6 months age band exceeds that of the 6-12 months age band, it indicates a scenario where new Bitcoin investors hold more value and profits in their holdings. Historical Bitcoin price cycles in 2015-2016 and 2018-2019 have shown that a bull run usually begins once this shift occurs following a price correction.
However, the current situation is different, and this process may be more time-consuming. More new investors are needed to increase the value in the wallets of short-term holders and encourage them to adopt a long-term approach and prevent sell-offs. This conversion of short-term holders into long-term holders may take time and prolong the process of the BTC bull run.
Is 100K BTC Possible?
Bitcoin has delivered impressive returns in 2023, rising by ~69% year-to-date. Interestingly, the correlation between $BTC and the technology-focused Nasdaq 100 index has decreased significantly, dropping from 0.75 in October to the current value of 0.3, indicating a weakening of their relationship.
Source: CryptoQuant
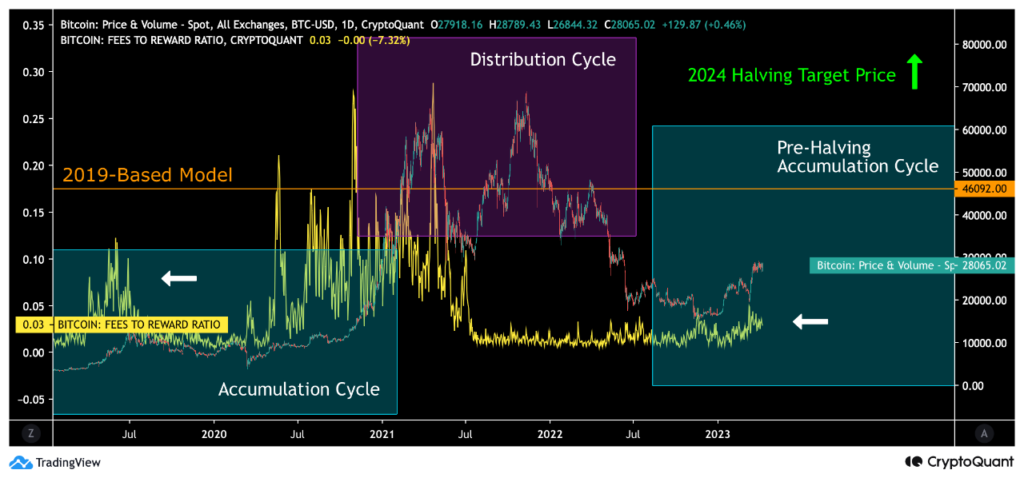
We can analyze Bitcoin’s market behavior through the lens of multi-year cycles comprising accumulation (turquoise) and distribution (purple) phases. Smart money (institutions) tends to favor accumulation cycles, while retail demand is more characteristic of distribution cycles.
Moreover, halving events, preceded by accumulation cycles (turquoise) are crucial phases of the Bitcoin cycles. Before the start of a distribution cycle, there is often a spike in fees to reward on-chain data (yellow). This phenomenon occurred in 2019 and 2020, and it can help forecast the transition from an accumulation to a distribution cycle.
During the accumulation cycle of 2019, the fees-to-reward ratio spiked before the summer relief rally (white arrow on the left), rising to 0.12. In 2020, the fees-to-reward ratio spiked again, reaching 0.21 in May and 0.29 in November.
Besides, the fees-to-reward indicator appears to be spiking again (white arrow on the right). Additionally, Bitcoin is moving towards a previously predicted price model based on 2019 data, which forecasts a spot price level of $46,092.
According to the model, Bitcoin should reach its target during the upcoming summer of 2023. However, the real target is the halving event of 2024, which represents a paradigm shift in the sequence of Bitcoin’s market cycles.
The next halving event will most likely occur on April 29th, 2024, and it will increase the scarcity of Bitcoin by reducing the block reward from 6.25 to 3.125. After reaching the 2019-based target price of $46,092, it is possible that Bitcoin could reach $100,000 following the 2024 halving event.
MVRV Ratio and Insights
The Bitcoin MVRV ratio is a valuable tool for analyzing market trends by comparing the current market capitalization to the realized capitalization of the cryptocurrency. This metric has proven to be a reliable indicator of market behavior for three halvings.
One of the critical uses of the MVRV ratio is in identifying market trends. When market capitalization grows faster than realized capitalization, the MVRV ratio increases, which may indicate a higher probability of sell-offs.
Conversely, when the realized capitalization surpasses the market capitalization, the MVRV ratio decreases, implying a possible decline in selling pressure.
Source: CryptoQuant
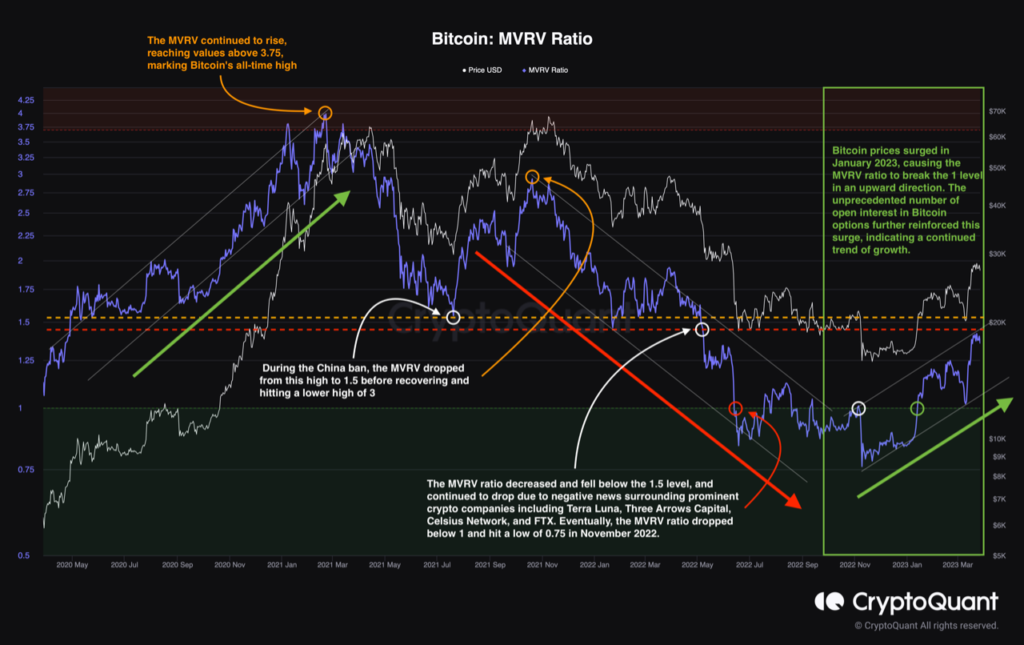
After the COVID crisis, Bitcoin’s MVRV turned green in April 2020, indicating values above 1, and continued to rise, reaching an all-time high above 3.75, marking Bitcoin’s ATH.
However, during the China ban, the MVRV dropped to 1.5 before recovering and hitting a lower high of 3. Then, MVRV started to descend and eventually broke the 1.5 level owing to negative narratives surrounding major crypto firms like Terra Luna, Three Arrows Capital, Celsius Network, and FTX.
In November 2022, the MVRV ratio dropped below the 1 level, hitting a low of 0.75. However, in January 2023, there was a substantial increase in Bitcoin prices, driven by significant accumulation in both spot and derivatives markets. This surge was further supported by the record-breaking number of open interests in Bitcoin options, indicating a continued growth trend, and the MVRV ratio subsequently broke the 1 level upward.
Analysis of the MVRV ratio reveals the importance of the 1.5 level, and the question arises whether the ratio will surpass this level to sustain the upward trend. This scenario is highly likely as users rapidly withdraw Bitcoin from exchanges, leading to a scarce supply.
Insights From Exchange Bitcoin Inflow and Outflow
Before we analyze Bitcoin inflow and outflow, let’s first understand the basics of correlation analysis.
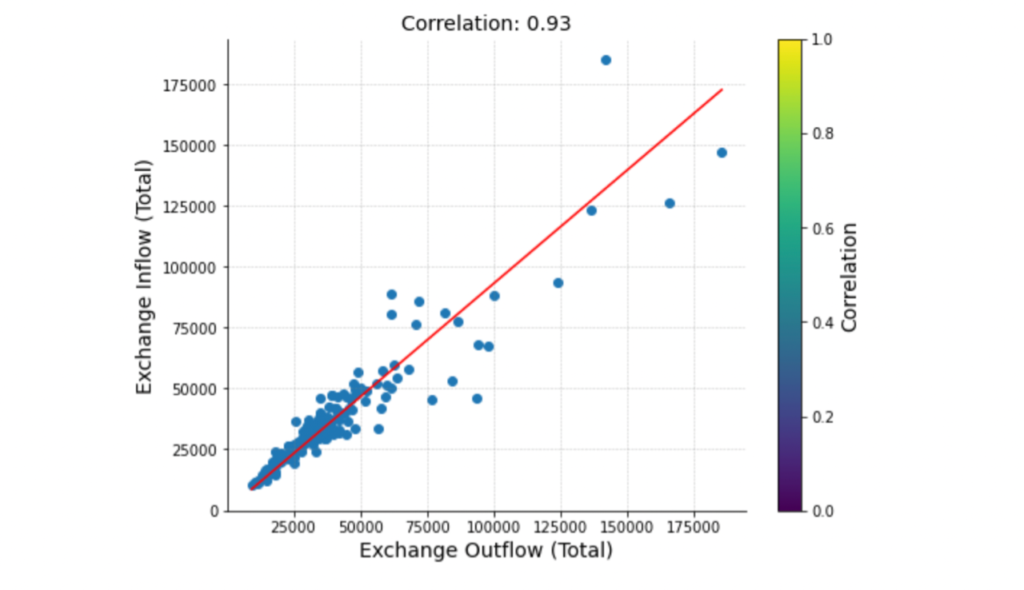
Correlation analysis is a statistical method that measures the direction and strength of the relationship between two variables. When two variables move in the same direction, it is referred to as a positive correlation, whereas if they move in opposite directions, it is a negative correlation.
A correlation coefficient of 0.93 indicates a strong positive correlation between Bitcoin inflows to exchanges and Bitcoin outflows from exchanges. It means that as inflows increase, outflows also tend to increase. Besides, the high correlation coefficient suggests that these two metrics are closely linked, and we can use changes in one variable to anticipate changes in the other variable.
Source: CryptoQuant
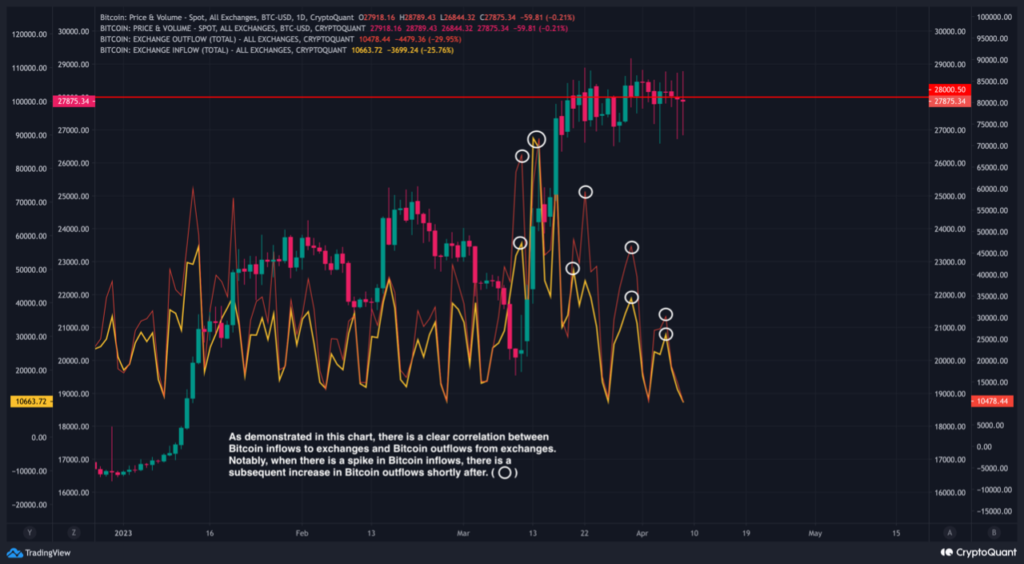
When there is a significant increase in Bitcoin inflows to exchanges, it is likely that short-term holders are selling their bitcoins at high prices to secure profits, leading to downward pressure on prices and a rise in the short-term holders’ Realized Price.
On the other hand, a substantial increase in Bitcoin outflows from exchanges, usually following a surge in BTC inflows as indicated by the correlation graph, may show a growing interest in holding the asset outside of exchanges, likely by long-term holders. This trend could contribute to a decrease in the Realized Price of long-term Holders.
Source: CryptoQuant
The takeaway?
Expanding on the previous points, the movement of Bitcoin’s price from a lower range of $27,500-$27,800 to above $28,000 may imply that long-term holders have taken advantage of the price dip and withdrawn their bitcoins from exchanges. This withdrawal of Bitcoin from exchanges reduces the available supply, leading to a price surge as demand may rise in the face of diminishing supply.
On the other hand, if Bitcoin’s price drops below the $28,000 level, it could suggest that short-term holders have sold their coins at prices ranging between $28,500 and $28,000, thereby increasing the available supply on exchanges. This rise in supply may add downward pressure on prices as demand may decrease in response to an ampler supply.
Whales and Fund Flow
The fund flow measures the ratio of coin transfers involving exchanges to the total coin transfers across the network, indicating investor activity on exchanges. However, a pattern has emerged where fund flows increase and decrease, and then the Bitcoin price experiences a squeeze and bounces back up.
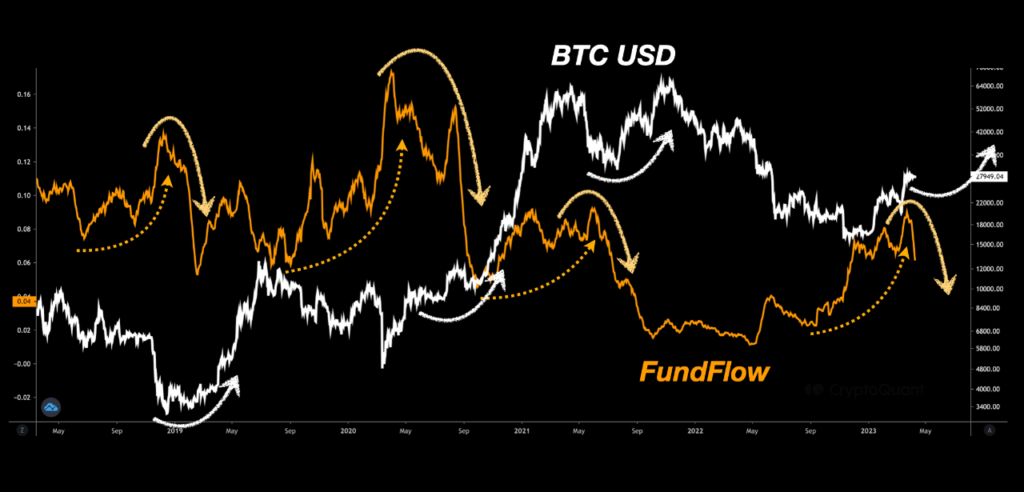
Source: CryptoQuant
A possible reason for this current pattern is due to whales deciding to launch an increase in fund flows, doing this by making active trades on exchanges in order to set a market bottom. It, in turn, led to increased demand from institutions and other over-the-counter (OTC) market participants because they perceived that the market had reached its bottom.
If these whales were successful in convincing OTC institutions to buy, we could expect to see a significant decline in fund flows and a further rise in the market, in line with past trends.
⬆️ For more cryptocurrency news, check out the Altcoin Buzz YouTube channel.
⬆️ Our popular Altcoin Buzz Access group generates tons of alpha for our subscribers. And for a limited time, it’s Free. Click the link and join the conversation today.

")
