


")


 Tokens Playing This P2E Game")

After a turbulent weekend marked by chaos, confusion, and the demise of several crypto banks, things are recovering for now. The Feds appear to be intervening to prevent the coin’s failure now that USDC has almost recovered the peg. Let’s see what’s going on in the cryptocurrency market this week.
The Macro Landscape
Bitcoin surged above $24,000 for the first time in over two weeks as investors breathed a sigh of relief after U.S. regulators intervened to back deposits at Silicon Valley Bank (SVB) and Signature Bank (SBNY). The market grew optimistic that the near meltdown of the banking sector would prompt the Federal Reserve to scale back its hawkish monetary policy.
Before retreating barely above the $24,200 level, the largest cryptocurrency by market capitalization had recently traded as high as $24,500. BTC had fallen below $20,000 last Friday as SVB crashed.
Several experts claimed the regulators’ moves to allow depositors at crypto-friendly Signature Bank and Silicon Valley Bank late on Sunday eased the markets. The state’s top regulating body shut down Signature, claiming it had “taken possession of the bank to protect depositors.”
Although the immediate surge may be tempting, investors should keep in mind that the March 14 publication of the United States Consumer Price Index (CPI) will significantly impact the market. Jerome Powell, the Fed chairman, stated in his most recent testimony that controlling inflation was much more complicated than expected.
The risk-on assets could plummet if the CPI comes in higher than anticipated, triggering a rally for the U.S. dollar.
Less of a rebound occurred in the stock market, initially climbing after President Biden declared an emergency backstop for bank deposits in trouble, only to see that impetus wane as the day progressed. At market closure, the Dow and S&P closed in the red, down 0.15% and 0.28%, respectively, while the Nasdaq went up by 0.45%.
Circle and SVB
The biggest bank failure since the global financial crisis (GFC) occurred on Friday, March 10th, when authorities shut down Silicon Valley Bank (SVB), a $209 billion asset bank.
Contrary to the GFC bank failures, brought on by inadequate management of collateral risks, the SVB crash was triggered by poor management of duration risk, aggravated by quickly rising interest rates from a Federal Reserve stuck amid a high inflation scenario.
Duration risk occurs when a bank ties up too much capital in long-term assets to the point where it is unable to meet short-term account withdrawal demands.
Once the bank’s dire situation spread on social media, depositors raced to withdraw their money, triggering a “run on the bank” and eventually leading to the FDIC’s takeover.
SVB held roughly $3.3 billion of the cash reserves kept by Circle, which created the popular stablecoin on DeFi, USDC. These accounts are the most liquid despite making up only about 8% of USDC’s $40 billion in assets. Circle holds the majority of reserves in treasuries with BNY Mellon.
Concerns Raised
USDC users were concerned that Circle’s capacity to fulfill refund requests might be seriously compromised.
Consequently, USDC holders quickly abandoned the stablecoin, leading to a record-breaking deposit level on CEXs and a severe liquidity crunch within DeFi.
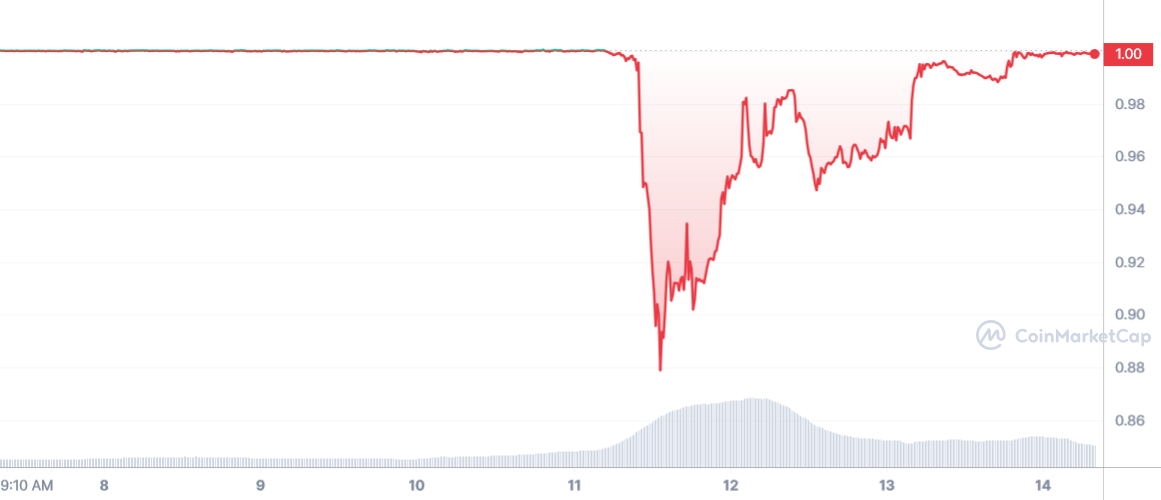
Ultimately, as the price of USDC diverged from the $1.00 peg, Coinbase halted USDC to USD conversions. Price fell more than 13% by Saturday morning due to the sharp drop in USDC demand, reaching a low of $0.87 before eventually rising back to $0.95-0.97 after Circle assured that redemptions would proceed regularly on Monday.
The U.S. government’s promise to reimburse SVB customers pushed the value of the USDC back up to $0.99.
The news that the Federal Reserve would intervene to make it easier for people to withdraw their money seemed to catalyze the crypto market’s recovery.
It is crucial because, if nothing is done, the impact on the crypto industry and businesses would be devastating. Bank bailouts are controversial, but the harm they would cause will be even more controversial.
Volatility in the Stablecoin Scene
After one of the most pivotal weeks of 2023, the digital asset sector is short three crypto-friendly U.S. banking institutions and faces an increasingly hostile regulatory climate.
While conventional financial markets were closed over the weekend, several stablecoins witnessed a deviance from the $1 peg before recovering on Sunday as word of guaranteed deposits spread.
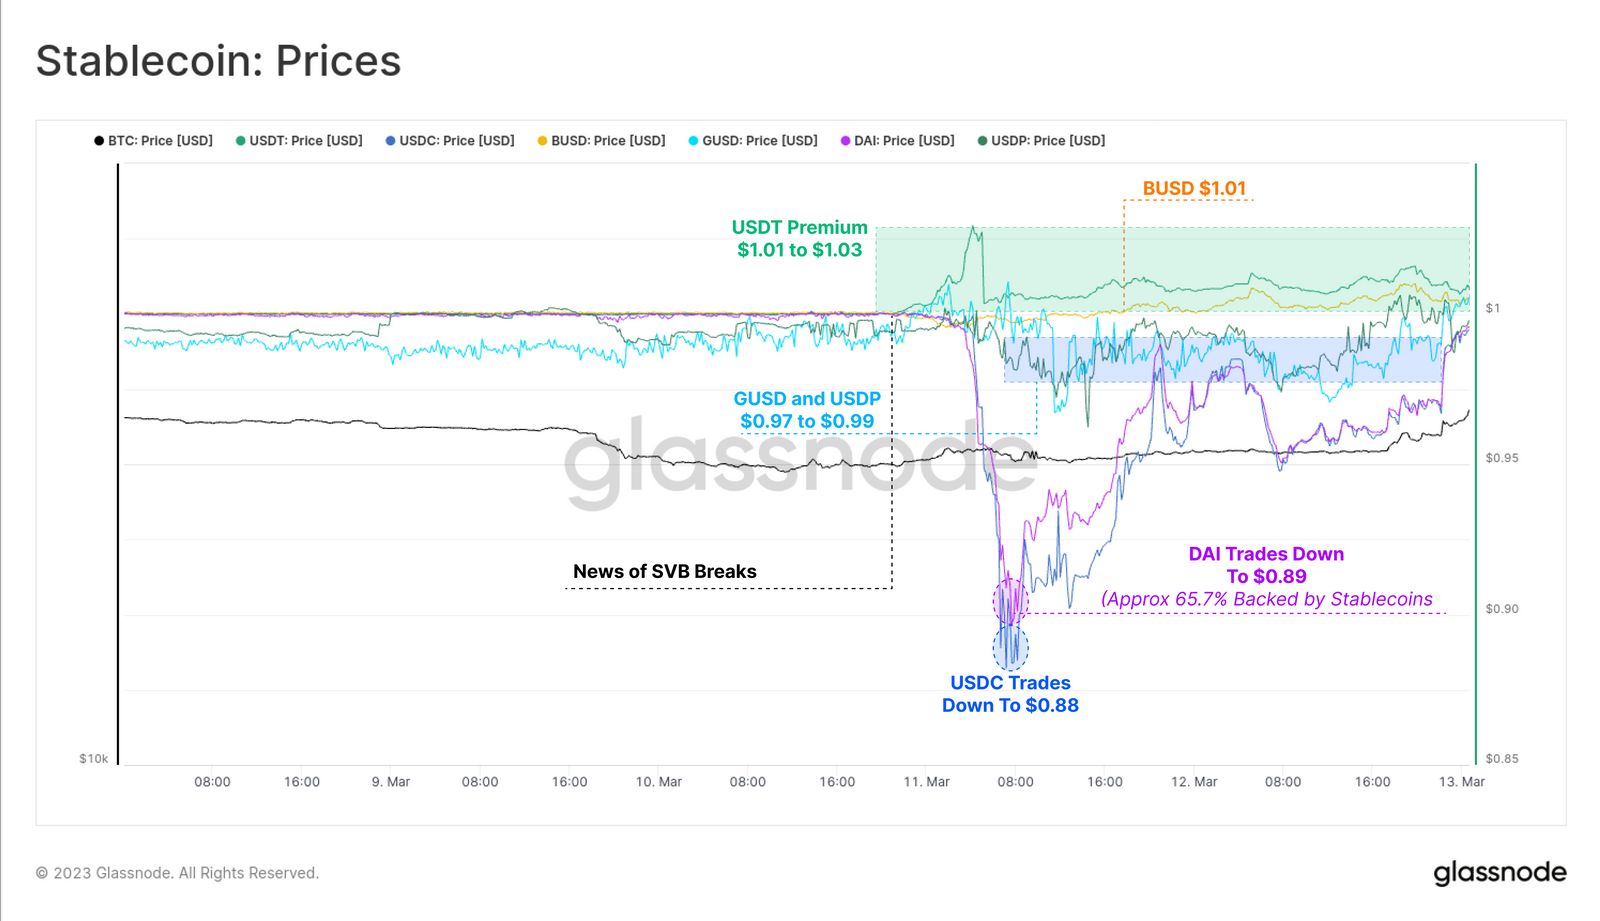
Stablecoin values have experienced instability for the first time since the demise of the LUNA-UST project, sparked by worries that USDC may become partly unbacked. USDC dropped to a low of $0.88, followed by DAI at $0.89, the latter due to DAI’s roughly 65.7% stablecoin collateral backing.
While GUSD on Gemini and USDP on Paxos traded at a slight discount to their $1 peg, BUSD and Tether values traded at a premium. It was noticeable throughout the weekend that a premium of between $1.01 and $1.03 had emerged for Tether.
Ironically, investors viewed Tether as a secure refuge despite concerns amidst a broader contagion from the tightly regulated U.S. banking sector.
USDC Depeg Takes a Toll on DeFi
Web3 has essentially built DeFi on USDC. The stablecoin is vital for lending protocols’ stability and makes up a sizable part of the resources used by decentralized stablecoins like DAI. Numerous DeFi protocols have been developed with the understanding that USDC would never de-peg.
Over the weekend, trade volumes handled by Uniswap and Curve reached new highs as traders exchanged USDC for ETH and other stablecoins, especially USDT. Since March 10, USDC-USDT volumes through Curve and Uniswap V3 have been nearly identical, at $5.91 billion and $5.96 billion, respectively. Curve recorded a low of $0.6911 for USDC relative to USDT, while Uniswap V3 recorded a low of $0.6188.
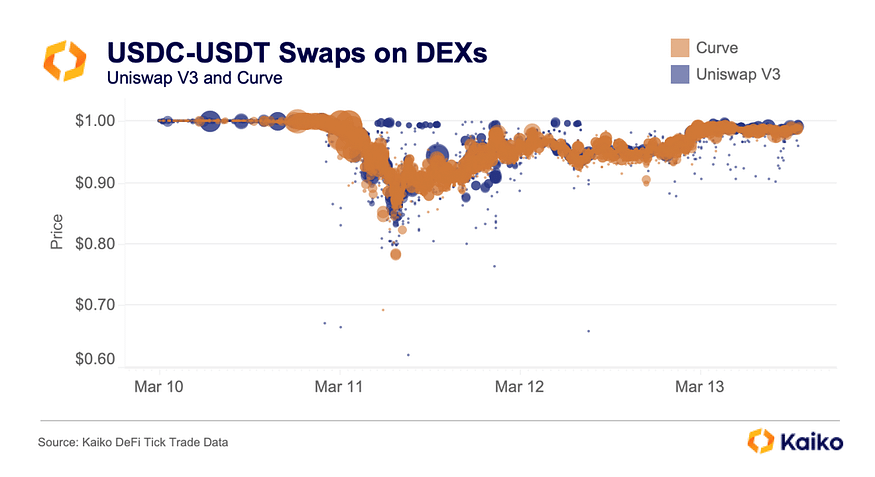
Rushing to get out of USDC caused a severe unbalance in the Curve 3pool, with USDT falling as low as 2% of the pool. Currently, the 3pool has just under $400 million, almost all of which is made up of USDC and DAI, demonstrating the high demand for USDT.
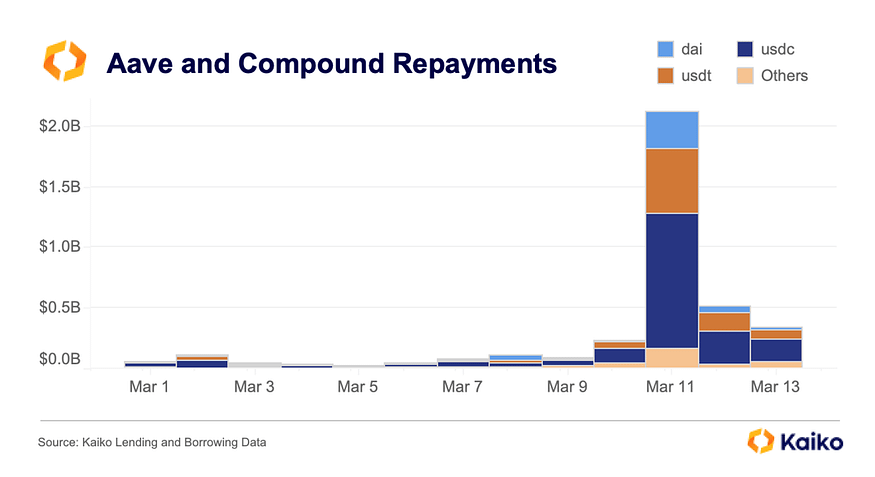
This scenario also impacted the lending and borrowing pools. Aave and Compound got more than $2 billion in repayments on March 11 — mainly in USDC — from debtors who could pay back their debts at a reduced rate due to the depegging.
Additionally, with a hard coded USDC price, Maker and DAI took on a lot of risk and volatility as arbitrageurs could use the price differences to offload over $2 billion of USDC to the PSM, more than doubling the USDC that Maker possessed.
Are We in a Transitional Phase?
Overall, DeFi markets went through two days of extreme price volatility that generated arbitrage possibilities throughout the network and emphasized the significance of USDC.
The current market situation is comparable to a Transitional Phase, which usually happens in the latter phases of the bear market. The “Net Unrealized Profit/Loss” (NUPL) metric provides evidence for this claim.
The weekly average of NUPL has changed from a situation of net unrealized loss to a gain since mid-January. It suggests that the typical Bitcoin owner currently holds a net unrealized profit of nearly 15% of the market cap. This pattern echoes the transitional stages of prior bear markets 🟧 in terms of market structure.
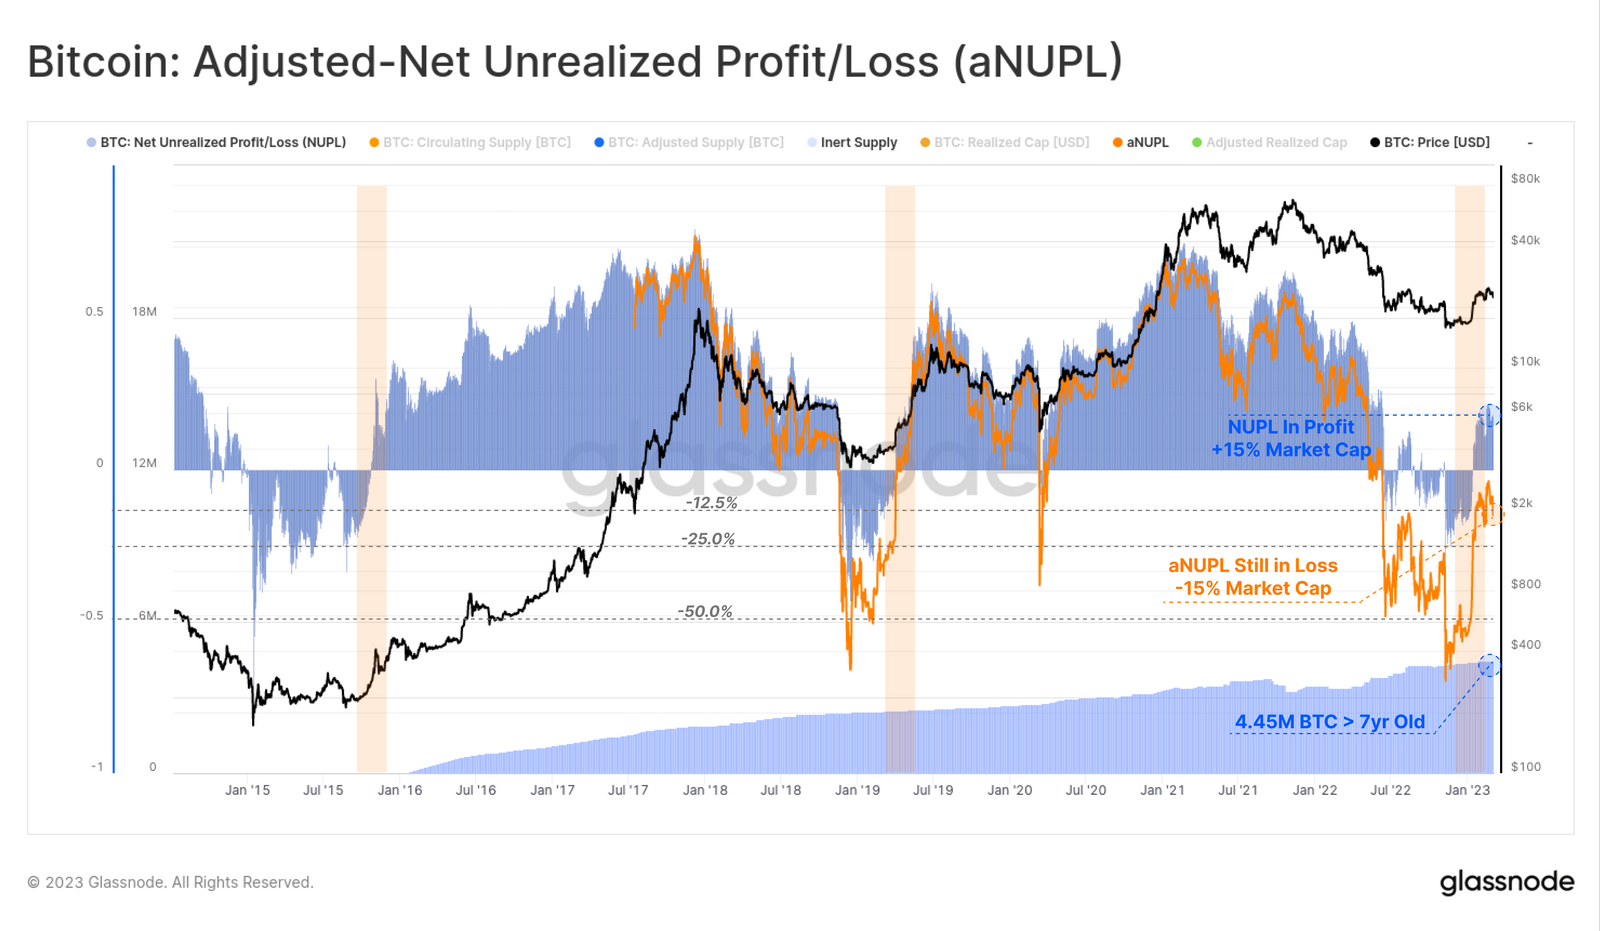
By deducting the unrealized profit trapped in the assets at least seven years old, we can also account for missing coins and get a modified version of this metric (aNUPL) 🔵. By this standard, the market is arguably still in a bear market, albeit it is only marginally below break-even.
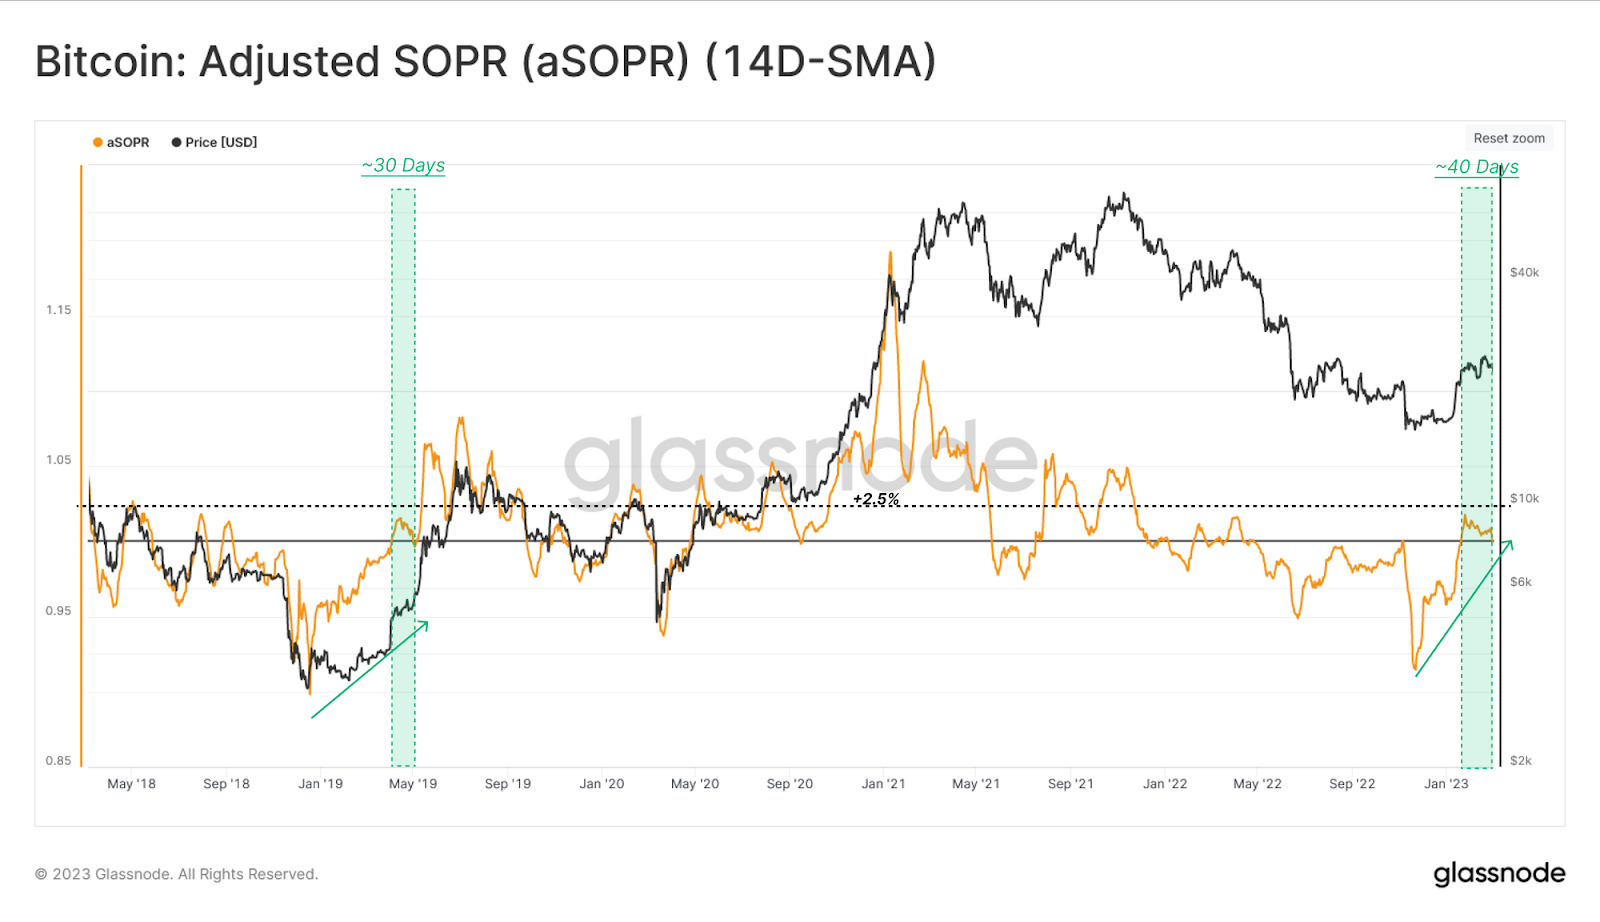
Another helpful metric is aSOPR, which tracks transactors’ average profit or loss as more coins circulate the network. The 14-day average of aSOPR 🟩 has consistently remained above 1.0 for the past 40 days.
This pattern highlights the first significant uptick in profit-taking since March 2022 and exhibits a non-trivial return of capital inflows adequate to absorb the profits realized.
When the market rebounded from significant and prolonged losses, one typical feature was the resumption of an aSOPR trading above 1.0 continuously.
Bitcoin’s Safe Haven Status: Is It Back?
Before the turbulence in the cryptocurrency market, Bitcoin was regarded as a safe investment or a low-risk commodity because many thought it to be untouched by changes in the global financial markets.
Gold, an asset type regarded as one of the most secure assets, has also shared this status. The precious metal has mostly stayed the same over the years as it could endure all phases of economies while still holding onto its worth.
Despite being a relatively new asset, BTC quickly acquired this reputation following its debut. But it recently lost it due to increasing instability and a growing connection with the stock markets. As a consequence, the price of BTC changed in line with any significant economic event.
However, it appears that the biggest coin by market value is currently following gold’s lead. Charts and similar recoveries suggest that the prices of Bitcoin and gold may be moving in tandem.
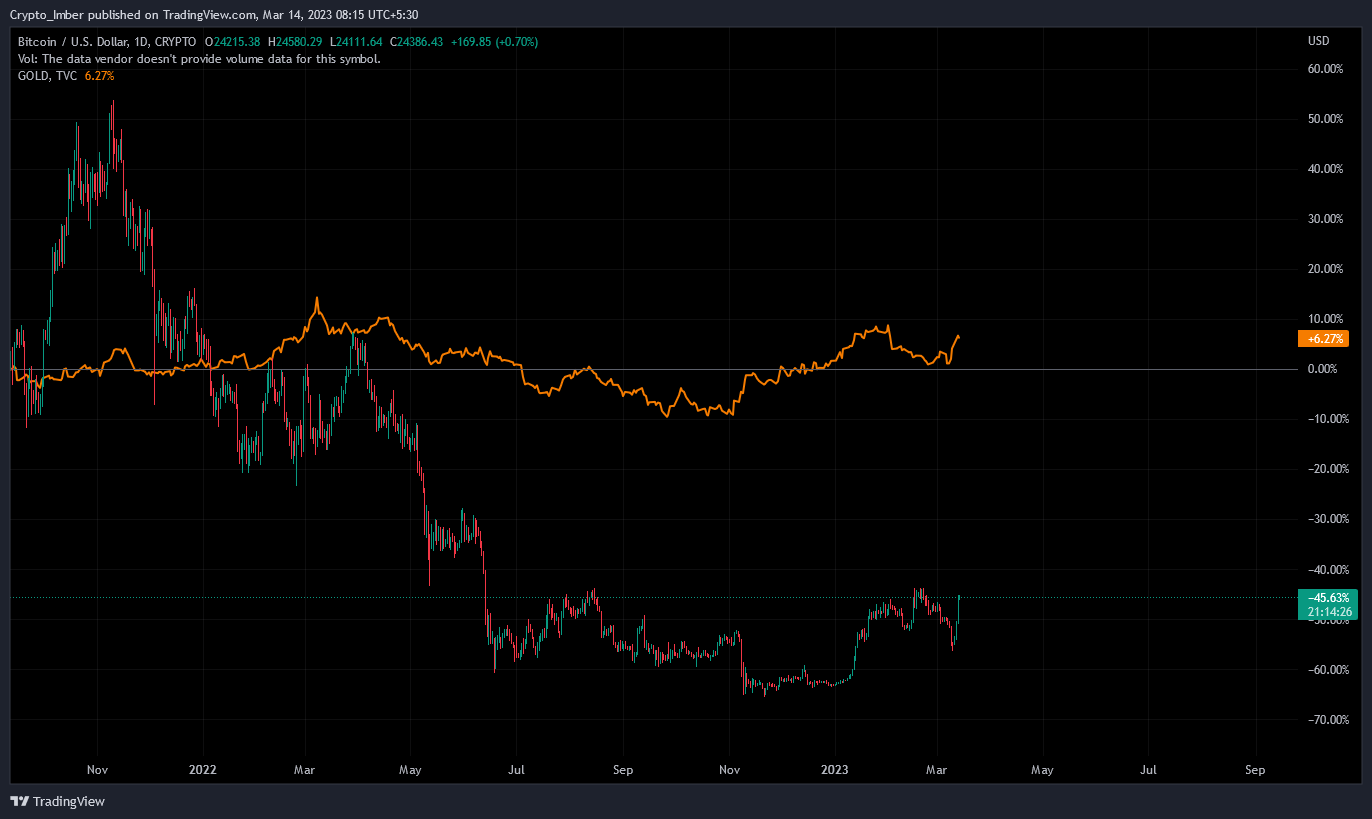
BTC is trading above $24,100, recovering nearly 18% of its losses in February. Similarly, gold suffered a setback but quickly bounced back. So much so that the trajectories of GOLD and BTC mirror one another.
Investors looking to hedge their funds against the possibility of future bank failures would likely increase their gold purchases, giving Bitcoin an extra push.
What Are Miners Doing Now?
Miners are a vital segment of market players because they have a significant quantity of assets and their selling behavior significantly impacts the market. They also affect the market in terms of investor sentiment.
The following chart illustrates the miner reserve metric, which counts miners’ assets in their wallets.
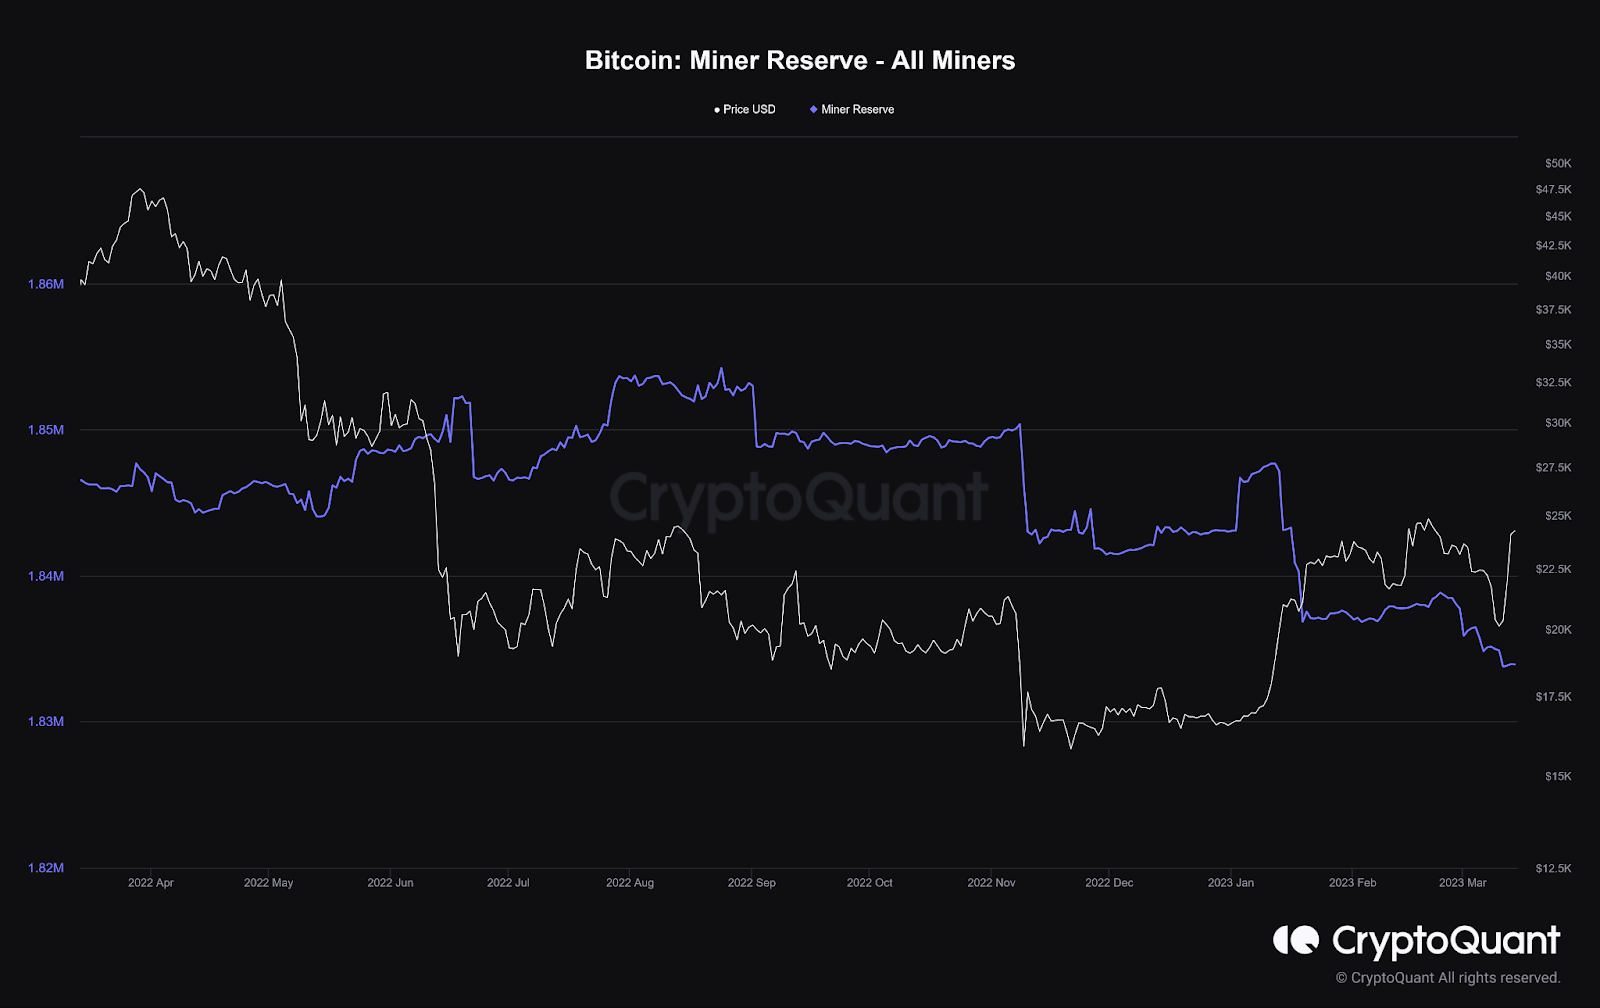
The miner reserve metric has entered a bearish trend and hit new annual lows, despite many on-chain metrics showing optimistic signals during the recent bullish stage of the market.
It demonstrates that the positive rise in Bitcoin’s price has given the miners an ideal chance to sell their assets, allowing them to keep a tight rein on their mining costs.
Bitcoin miners have been aggressively selling their assets since January 21, 2023, which is one of the reasons that led to a localized price correction.
Despite the recent bearish trend in the miner reserve metric, many on-chain metrics still suggest a bullish outlook for Bitcoin. It is still unclear how this divergence will play out and whether the selling behavior of miners will continue to impact the market in the coming months.
⬆️ For more cryptocurrency news, check out the Altcoin Buzz YouTube channel.
⬆️ Our popular Altcoin Buzz Access group generates tons of alpha for our subscribers. And for a limited time, it’s Free. Click the link and join the conversation today.


