


")


 Tokens Playing This P2E Game")

The GeckoCon 2022 started on July 14th focusing on how web3 initiatives will empower a decentralized future. Crypto entrepreneurs and innovators around the world are talking about how web3 will impact our economy.
In this first talk, Head of Research at CoinGecko, Zhong Yang, gives a recap of the crypto sector on Q2-2022, explaining important indicators. The title is “State of Web3”.
1) General Crypto Market Conditions
In this section, Tim Lee mentioned that Top 30 coins decreased its marketcap by 55.9% in Q2-2022. This caused the marketcap of the entire industry to decrease to less than $1 trillion until now. It’s important to mention that the highest value of the industry was in Nov 2021 with an ATH of $2.6 trillion. Here is a picture of it:
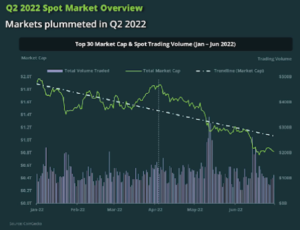
Source: GeckoCon 2022
Moreover, some of the main causes of this decline were the LUNA, WAVES, and Celcius problems. Also, spot trading volumes in Q2-2022 stayed very close comparing it to Q1-2022.
2) Stablecoin Overview
Apart from the UST disaster, USDT started having issues with its audits, which made its share decreased by almost 20%. As a result, USDC and BUSD increased their marketcap to $55.2 and $18 billion respectively. From another angle, the Top 5 stablecoins marketcap decreased by 18.3% in Q2-2022. Therefore, stablecoins like FRAX and DAI got into the Top 5 stablecoins as a “refuge” alternative even when they lost 48% and 32% of their marketcap respectively.
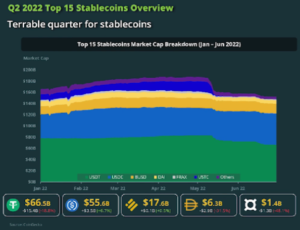
Source: GeckoCon 2022
Moreover, as you can see in the picture above, there is an important %A of the stablecoin market that was completely vanish. This proves that there were a lot of people who were liquidated in the UST trouble.
3) Crypto Market vs Bitcoin vs S&P 500 Overview
This is a common comparison indicator that gives a better idea of how these important niches behave. In Q2-2022, the crypto market-S&P 500 correlation was 0.92, which increased by 27% in comparison with Q1-2022 (0.72)
Moreover, the BTC – S&P500 correlation reached its ATH (0.75) on May 25th. This shows a strong correlation between both niches. However, this indicator dropped to 0.67 on June 30th.
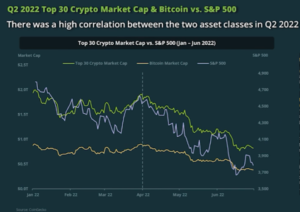
Source: GeckoCon 2022
In addition, the Top 30 coin’s marketcap moved in lockstep with bitcoin. Their comparison indicator was -1. Finally, it’s important to mention that the current crypto asset’s correlation with traditional markets is a trend. This is caused by the negative image that crypto is viewed by traditional investors.
4) Bitcoin Price vs Trading Volume Overview
In Q2-2022, Bitcoin’s price decreased 55.8% by having 8 consecutive weeks of negative numbers. As a result, bitcoin broke many resistance levels. The ATL this year reached $17,760 briefly which rebounded to $20k.
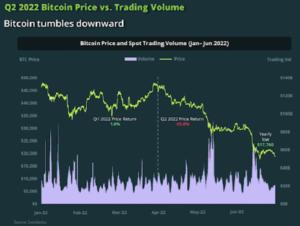
Source: GeckoCon 2022
Moreover, here are some related Q2-2022 events that affected bitcoin’s price:
- Equity Market: When the market fell, it also bring bitcoin down.
- LFG Foundation: They sold their bitcoin to protect the UST peg. However, it wasn’t enough to avoid the UST disaster, having a secondary effect on bitcoin.
- Three Arrows Capital Insolvency: This crypto investor firm had GBTC in its portfolio, triggering the Bitcoin crash.
- SEC Rejected BTC ETF: The SEC didn’t approve Greyscale’s Bitcoin ETF.
5) Bitcoin Mining Hash Rate Overview
In Q2-2022, bitcoin’s total hash rate become volatile. This might have happened caused of the new conditions in BTC mining’s market. When the price of bitcoin decrease, miners’ profits do the same. As a result, some BTC miners go offline.
This makes bigger BTC miners can have a better market share, which makes the hash rate go up again. This is a cycle that always repeats.
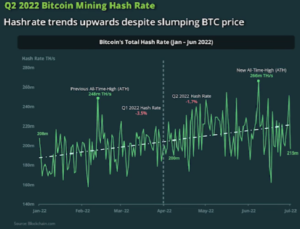
Source: GeckoCon 2022
Moreover, the drop in bitcoin’s price pushed miners to sell more. However, despite this situation, bitcoin’s hashrate is still trending positively. which had a new ATH on June 8th.
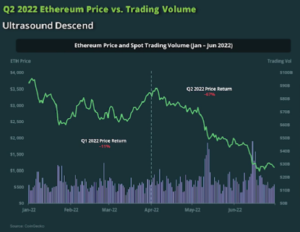
6) Ethereum Price vs Trading Volume Overview
In Q2-2022, the ETH price decreased 67.4% from the start of April to mid-June. In other words, ETH had 11 consecutive weeks in negative numbers. It was the first time this happen in ETH.
Also, ETH went down to $900 before recovering to $1,000. Nowadays, ETh is currently in the “simple moving average” support.
In addition, here are some of the most important events that affect ETHs price:
- Terra collapse: There were liquidations of leveraged positions using bETH.
- stETH loses 1:1 parity with ETH
- Gray Glacier hard fork in mid-September
Here you can read the second part.
For more cryptocurrency news, check out the Altcoin Buzz YouTube channel.
Find the most undervalued gems, up-to-date research and NFT buys with Altcoin Buzz Access. Join us for $99 per month now.


