


")


 Tokens Playing This P2E Game")

Bitcoin has hit $35,000 after another monumental rise, is it time to ask when this bull run will end and the bubble will burst once again, or is this time different. We look at the BTC chart in a way that discusses the rise in terms of financial market bubble economics.
Bitcoin has had bubbles burst on a number of different occasions in its past and if we consider that the past usually is an indicator of what will happen in the future this bubble should be no different from the historical bubbles. In reality, most investors in BTC expect some form of retracement eventually.
Below is an analysis of what has happened in the past when something like this happened to BTC. It’s important to remember that BTC isn’t alone in having a history of bubbles as we have seen this in the property market, in the stock market during the .com bubble, and in the commodity, market Oil is always undergoing periods of bubble-like activity.
A bubble is a normal and relatively conventional market movement in the economy. A bubble is a way of ensuring that assets don’t become overbought and over-inflated.
Profiting from a bubble
There is a huge opportunity to profit from a bubble both on the upside and the downside. If you know what you are doing you can go long on BTC and ride the trend upwards and sell when it reaches the top. On the flipside shorting bitcoin is easier than ever with the amount of crypto margin trading and CFD exchanges in the marketplace today. If you use your technical indicators and understand at what stage the bubble burst is a good time to switch from a long position to a short position you can really make substantial gains from both the rise and fall of BTC in a bubble situation.
The first thing to understand is the structure of a bubble so you make sure not to get over-excited when the “bull trap” happens or to not get out of your trade when the “return to normal” phase occurs.
A simple moving average indicator can be a great friend in these times as it can help you time your long and short positions into and out of the market.
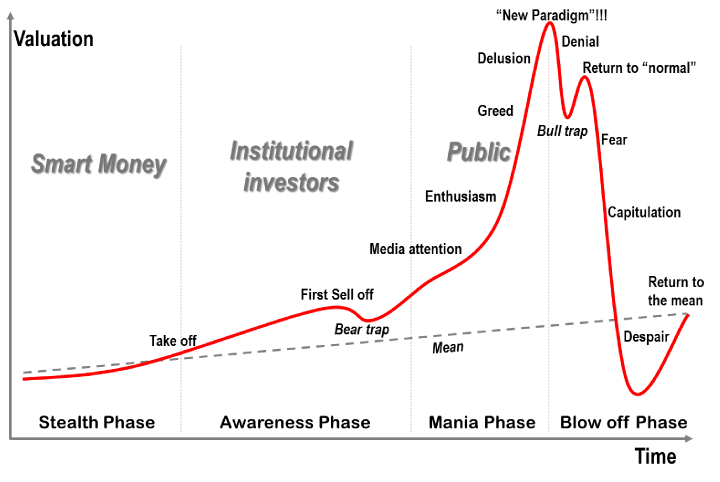
Chart of a market bubble
Source: seekingalpha.com
History of Bitcoin Bubbles
Since its inception in 2010 BTC has constantly been moving in and out of bubbles. In this section, we look at some of the historical bubbles that the BTC market has undergone.
The first 2011 bubble
The Peak: $1.06 (Feb. 14, 2011)
The Bottom: $0.67 (April 5, 2011)
In February 2011 Bitcoin had its first bubble burst when it reached dollar parity for the first time in its history. The bull run began as early as July 2010 when BTC was only worth a few cents per coin.
This bull run was associated with the underlying technology and as a result, the technology advances drove the price higher and higher.
The second 2011 bubble
The Peak: $29.58 (June 9, 2011)
The Bottom: $2.14 (Nov. 18, 2011)
The first truly astonishing BTC bubble occurred in June 2011 as the result of an article about the Silk Road on Gawker. The article spoke about how illegal drugs could be purchased with the cryptocurrency on the dark web website.
At the time there was also a significant surge in the number of cryptocurrency exchanges that opened and as a result buying, BTC became more accessible to the public.
The combination of these two factors sent BTC from $1 to $30 in just a few months.
Like any bubble, it eventually burst as it couldn’t sustain the growth at the time.
The 2013 bubble
The Peak: $1,127.45 (Nov. 29, 2013)
The Bottom: $172.15 (Jan. 13, 2015)
In a very short period of time, BTC went from dollar parity to be worth over $1,000. This was an important psychological threshold that was broken in November 2013. It does seem the BTC bubbles from this point onwards tended to be at the end of a year.
Like any of the bubbles in its history, the 2013 bubble resulted in a massive crash that didn’t recover for a number of years. That’s another important thing to consider, the amount of time it takes for BTC to recover after a bubble bursts can be 3 years.
The 2017 bubble
The Peak: $19,665 (Dec. 15, 2017)
The Bottom: $3,164 (Dec. 15, 2018)
2017 saw the largest bubble in BTC history with everyone and their grandmothers buying into this bubble. The mass media-fueled huge overbought frenzies when there was basically no one else to sell to.
The reason for this bubble was probably down to the wide range of Initial Coin Offerings (ICO) that were making huge promises.
Why this time is no different?
This time is no different because once again the price has to reach a level where no one else is looking to buy into the market and as a result, the sellers start taking their profits. In order to remain bullish, we need more buyers buying more and more of the asset but eventually those buyers dry up, and when they are sitting on massive profits the instinct to sell just becomes too strong.
")

