


")


 Tokens Playing This P2E Game")

Candlestick charts took over two centuries to make the journey from Japan to the Western hemisphere, and only a quarter century to become the standard charting method of traders from Wall Street to Main Street.
Technical analysis is claimed to have originated in feudal Japan in the 18th century, when it was used to trade rice receipts, before evolving into candlestick charting in the early 1800s. We discussed technical analysis and chart types in the previous article of this educational series. In this article, we’ll go through the top candlestick patterns that every trader should be aware of.
Candlestick patterns are typically known in pairs, with one indicating an upward trend and the other indicating a downward trend. As a result, we’ve chosen ten patterns that comprise five pairings, all of which indicate that a market reversal is possible. To begin, look for bullish patterns that appear after a decline and signal a reversal. When these patterns appear, cryptocurrency traders typically open long positions.
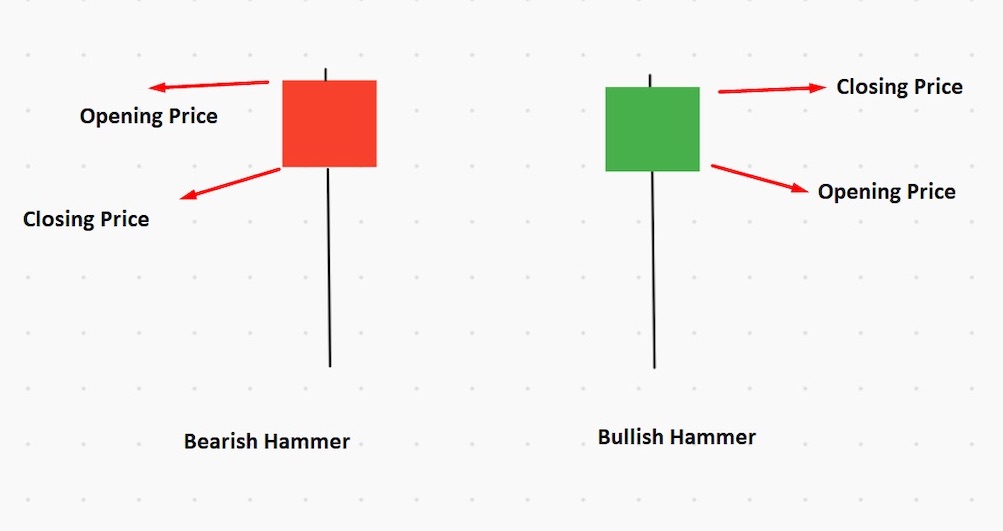
Hammer Pattern
A single candle in the hammer pattern has a short body and a long bottom wick that depicts like a hammer. It illustrates that trade began well below the starting price and ended up closer to the opening price than the session lows. When a hammer appears after a downtrend, it indicates that selling activity has slowed and buyers have taken control of the market.
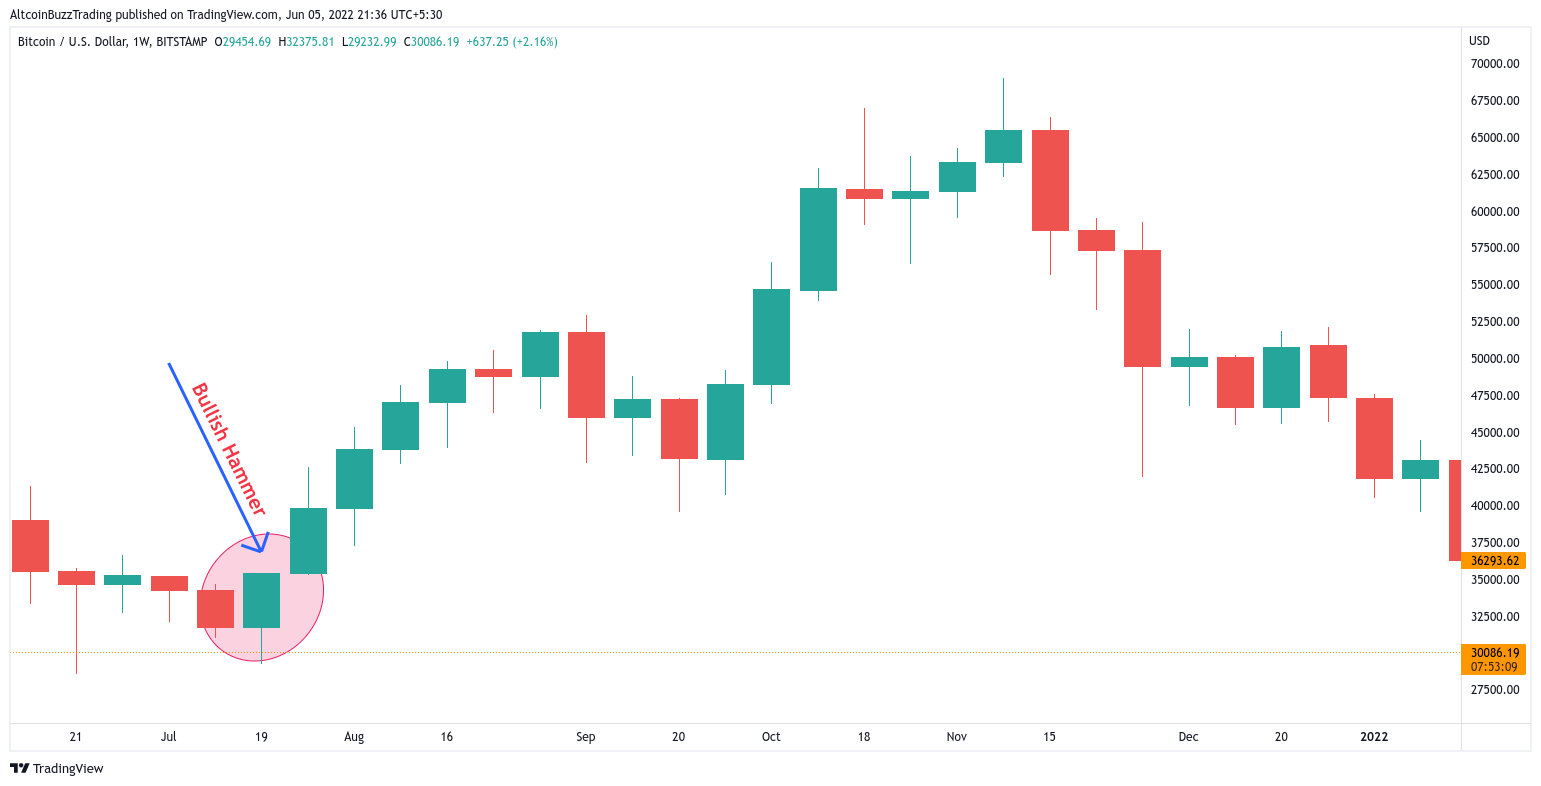
Bitcoin‘s weekly time-frame is shown above. We can observe a bullish hammer pattern, which was followed by a trend reversal.
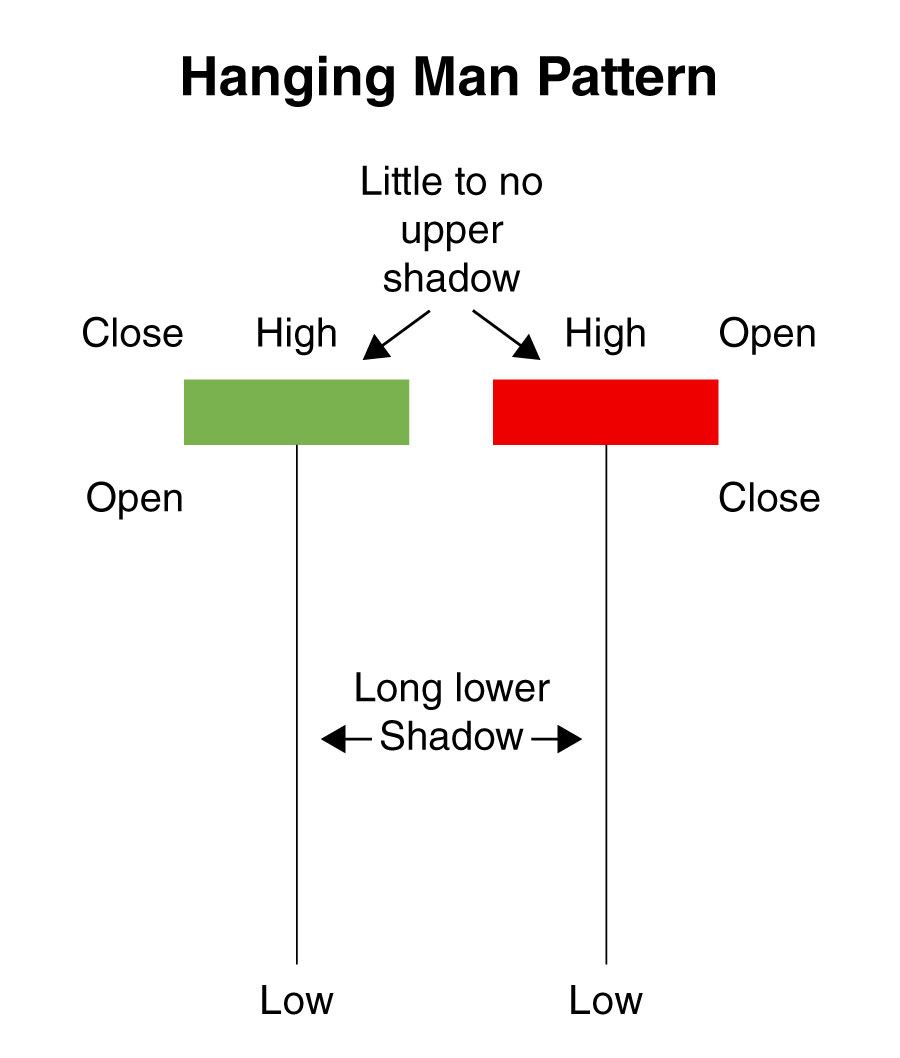
Hanging Man
The pattern for the hanging guy is the same as the hammer, but reversed. A green or red candlestick with a short body and a lengthy bottom shadow forms it. It appears near the end of an upward trend. It indicates a significant sell-off over a period of time, yet bulls may temporarily drive prices higher before losing control.
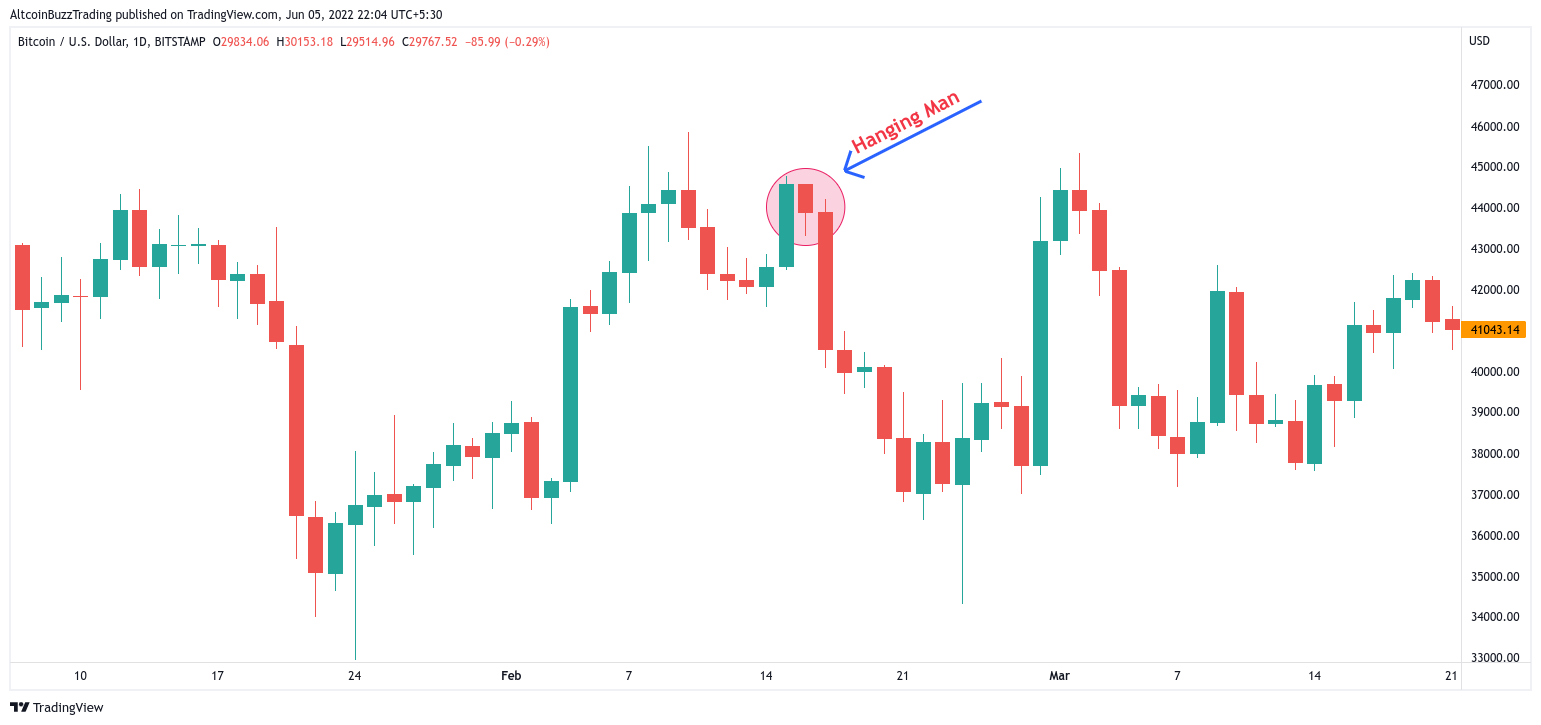
Bitcoin’s daily time-frame is shown below. It creates a hanging man pattern, which was followed by a trend reversal. The hanging man is a hammer-like candlestick pattern. It becomes a bearish reversal pattern when it arises after a rally.
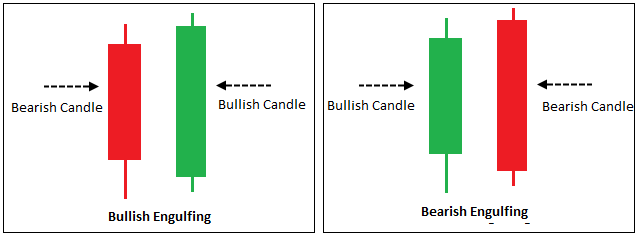
Engulfing Pattern
At market extremes, an engulfing pattern with two candles can predict a significant reversal. The first white-bodied candle appears in a bearish engulfing. Prices gap higher at the start of the next session, set a new high, and then pull and turn intraday to finish below the previous session’s body’s bottom.
This indicates that the bulls have made their final push and that the bears have successfully counterattacked, forcing the bulls to retire. At market bottoms, you can see bullish engulfing patterns. This is dubbed a key reversal by Western chartists. In a candlestick chart, it’s just a little more visible.
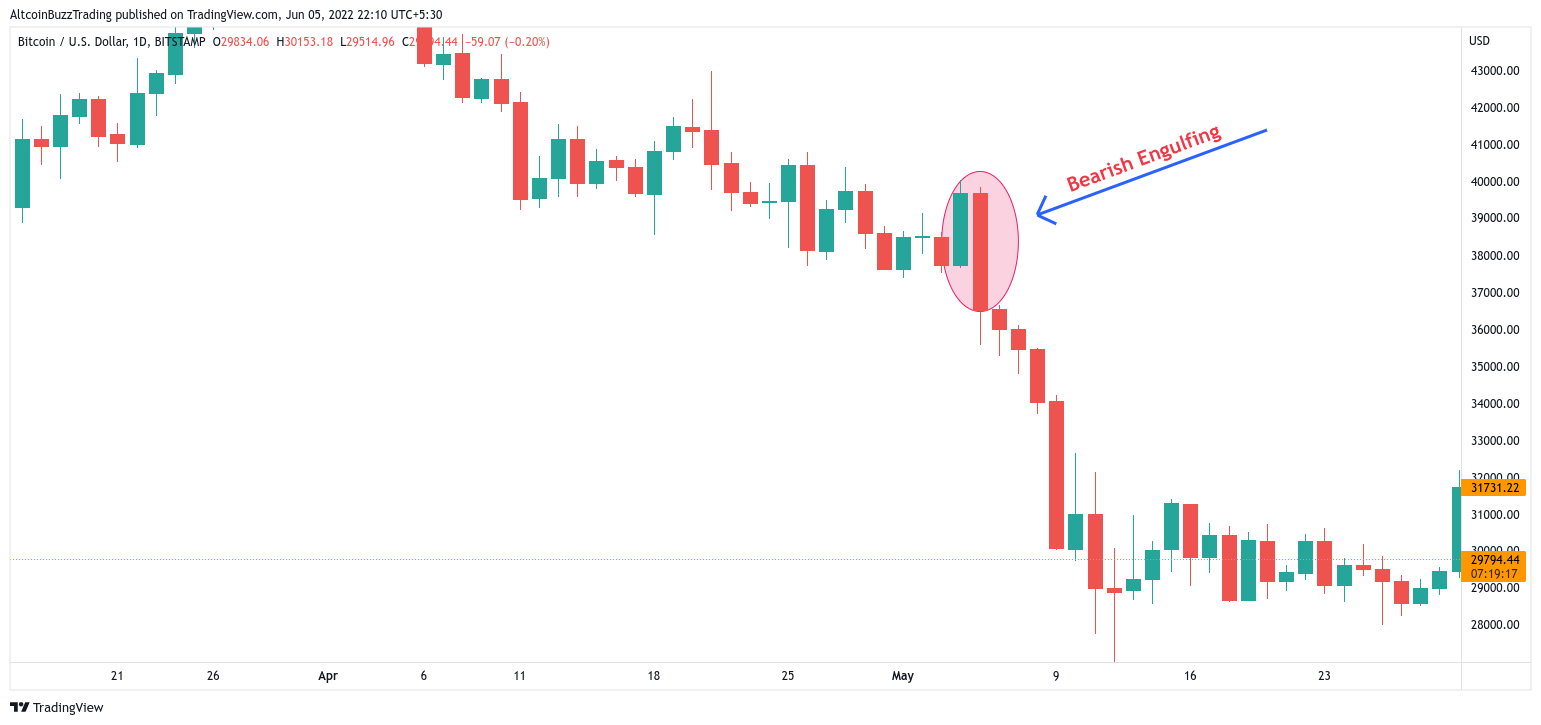
The daily time-frame for Bitcoin is depicted below. It resulted in a bearish engulfing pattern, which was followed by a substantial price decline.
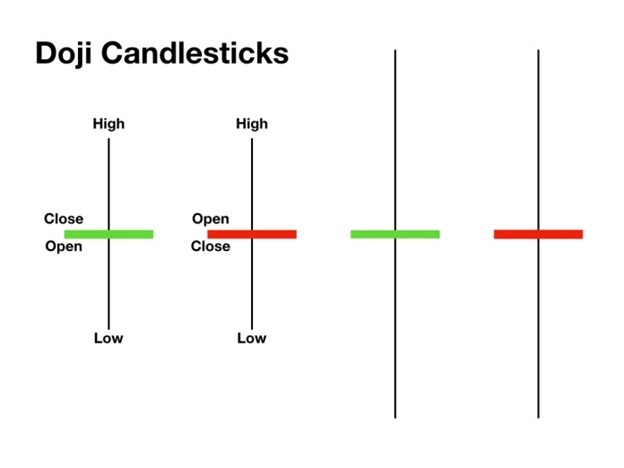
Doji Candlestick Pattern
The Doji candlestick has a very small body and casts very lengthy shadows. While it is commonly known as a trend continuation pattern, traders should be aware that it could potentially result in a reversal. To avoid confusion, open a position a few candles after the Doji and close it when the situation becomes obvious.
When a Doji pattern appears at the end of an overstretched trend, it means a reversal is approaching. If it occurs around the start of a powerful trend, it provides a second opportunity to enter a trade in that direction.
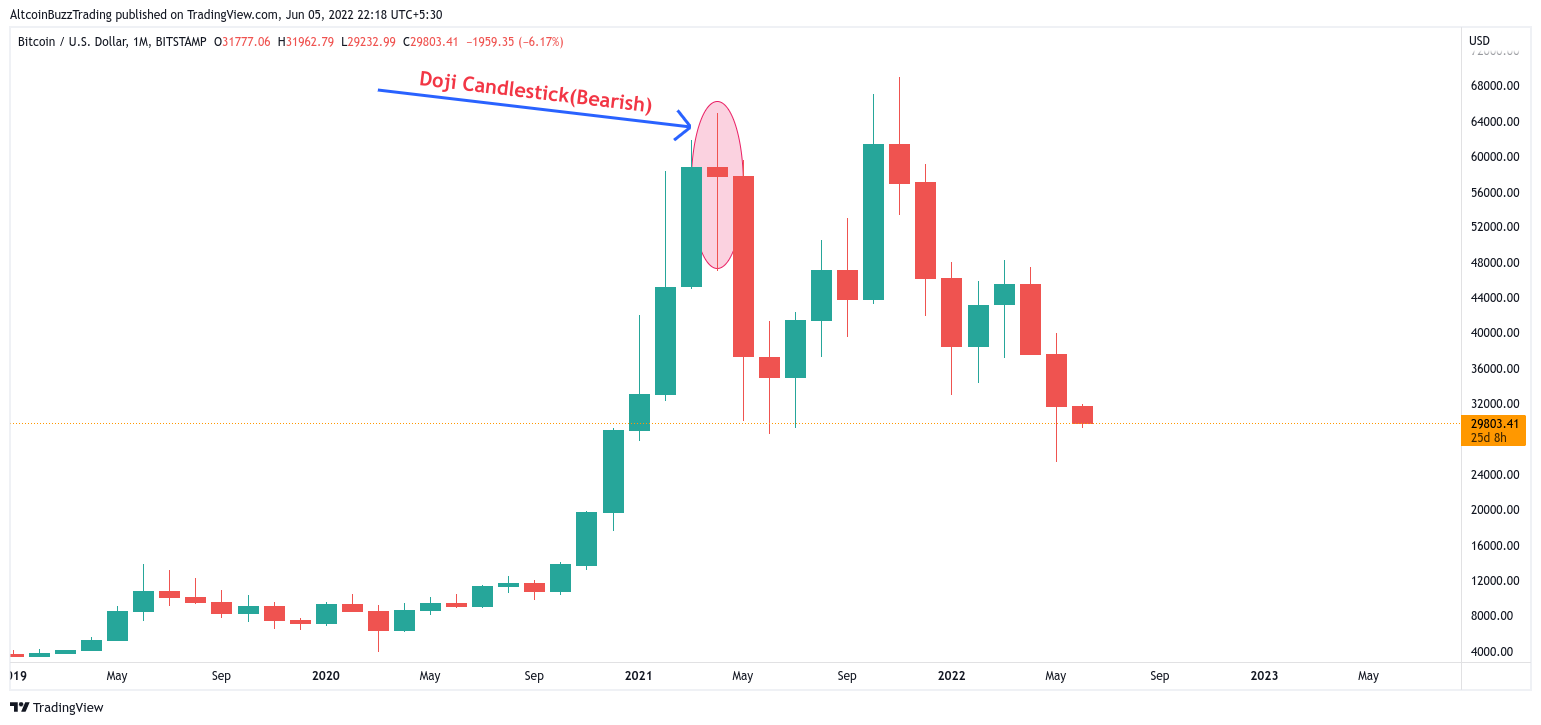
Below is a chart of Bitcoin’s monthly time frame. As a result, a bearish doji candlestick pattern formed, signaling a trend reversal.
Candlestick Continuation Patterns
One giant body candle makes this candlestick formation and it follows a three smaller candles that form in the opposite direction of the initial long candle. The three small-bodied candlesticks that follow form above and below the initial candlestick low and high. The third candle then takes on the same direction as the first. The third candlestick closes above the previous candlestick high and low. Even if there is some selling pressure, this candlestick formation indicates that buyers are regaining control of the market.
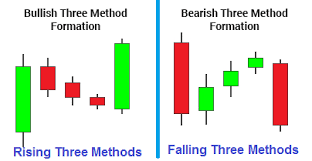
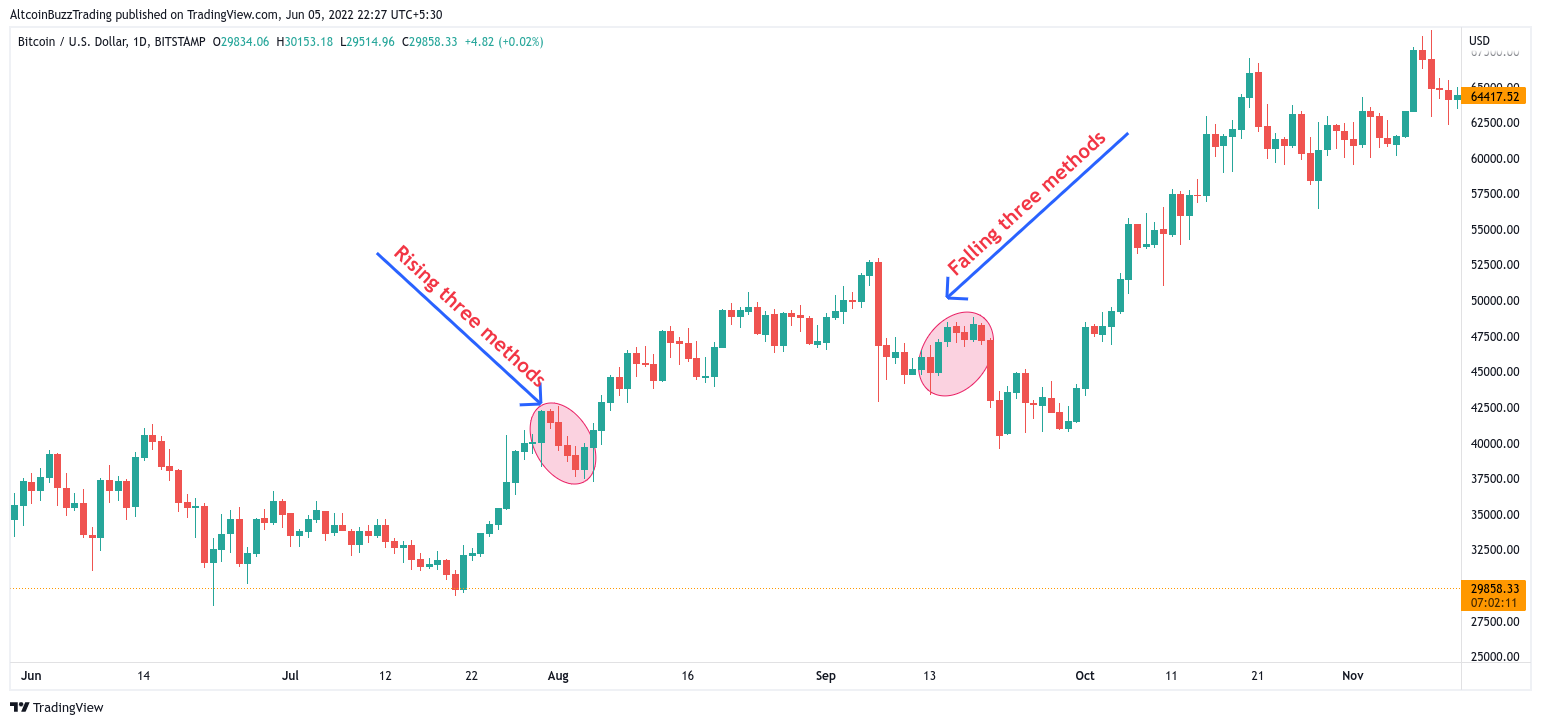
The Bitcoin daily time-frame is shown below. For bullish trend continuations, it resulted in a rising three method pattern. For bearish trend continuations, there’s also a falling three-method pattern.
Stars Candlestick Pattern
Morning Star and Evening Star candlestick patterns are the two most common patterns of famous stars’ candlestick patterns. The morning star candlestick pattern is a symbol of hope in a bearish market. The ‘star’ will often have no overlap with the lengthier bodies since the market gaps both on open and close. It means that the selling pressure from the first day has eased and that a bull market is on the horizon.
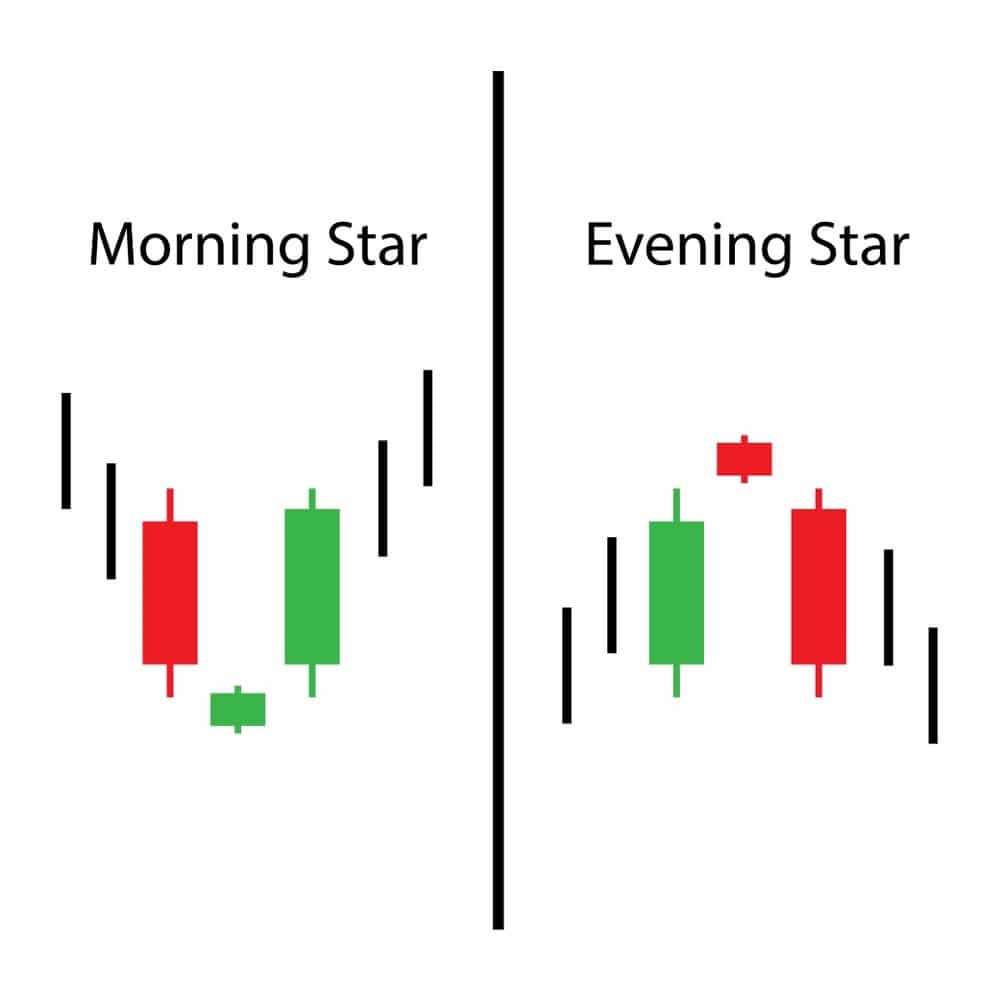
The bearish morning star’s opposite is the evening star, which is a three-candlestick pattern. This arrangement features a short candle in between a tall green candle and a large red candlestick. It indicates the end of an upswing and is particularly significant when the third candlestick wipes away the first’s gains.
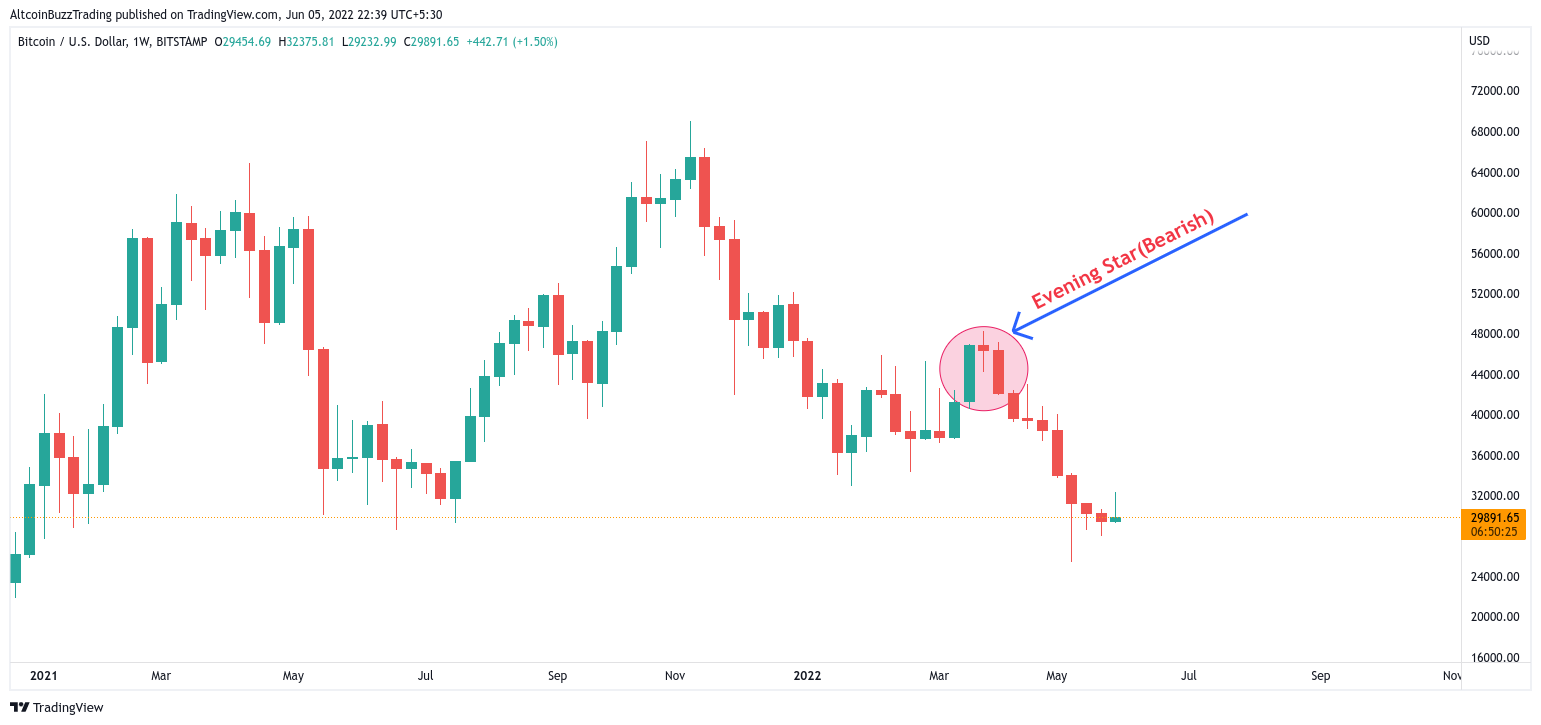
Below is a chart of Bitcoin’s weekly time frame. As a result, a bearish evening star candlestick pattern formed, signaling a trend reversal.
Conclusion
All of these patterns are useful indications of market conditions, but they are far from perfect. Furthermore, candlesticks are just one instrument in technical analysis, and many traders use a variety of other approaches as well, such as indicators and oscillators. A good risk management system should be in place for any new method that traders use.
And for our best, freshest research on NFT buys, Layer 1 chains, DeFi, or games, come check out Altcoin Buzz Access. Plans start at only $99 per month
For more information on cryptocurrency, visit the Altcoin Buzz YouTube channel.
Images courtesy of TradingView.
Disclaimer
The information discussed by Altcoin Buzz is not financial advice. This is for educational and informational purposes only. Any information or strategies are thoughts and opinions relevant to accepted levels of risk tolerance of the writer/reviewers and their risk tolerance may be different than yours. We are not responsible for any losses that you may incur as a result of any investments directly or indirectly related to the information provided.
Do your own due diligence and rating before making any investments and consult your financial advisor. The researched information presented we believe to be correct and accurate however there is no guarantee or warranty as to the accuracy, timeliness, completeness. Bitcoin and other cryptocurrencies are high-risk investments so please do your due diligence. Copyright Altcoin Buzz Pte Ltd. All rights reserved.


