


")


 Tokens Playing This P2E Game")

Some traders seem bullish, however, I think this is a difficult time for BTC. Let’s take a look at the charts and see what they suggest.
Coinbase – BTC/USD Short-Term Chart Analysis
- Current Price on CoinGecko at the moment of writing this article: $11,380
- Resistance levels: $17,200-300
- Support levels: $11,300, $10,000, $8,300-400
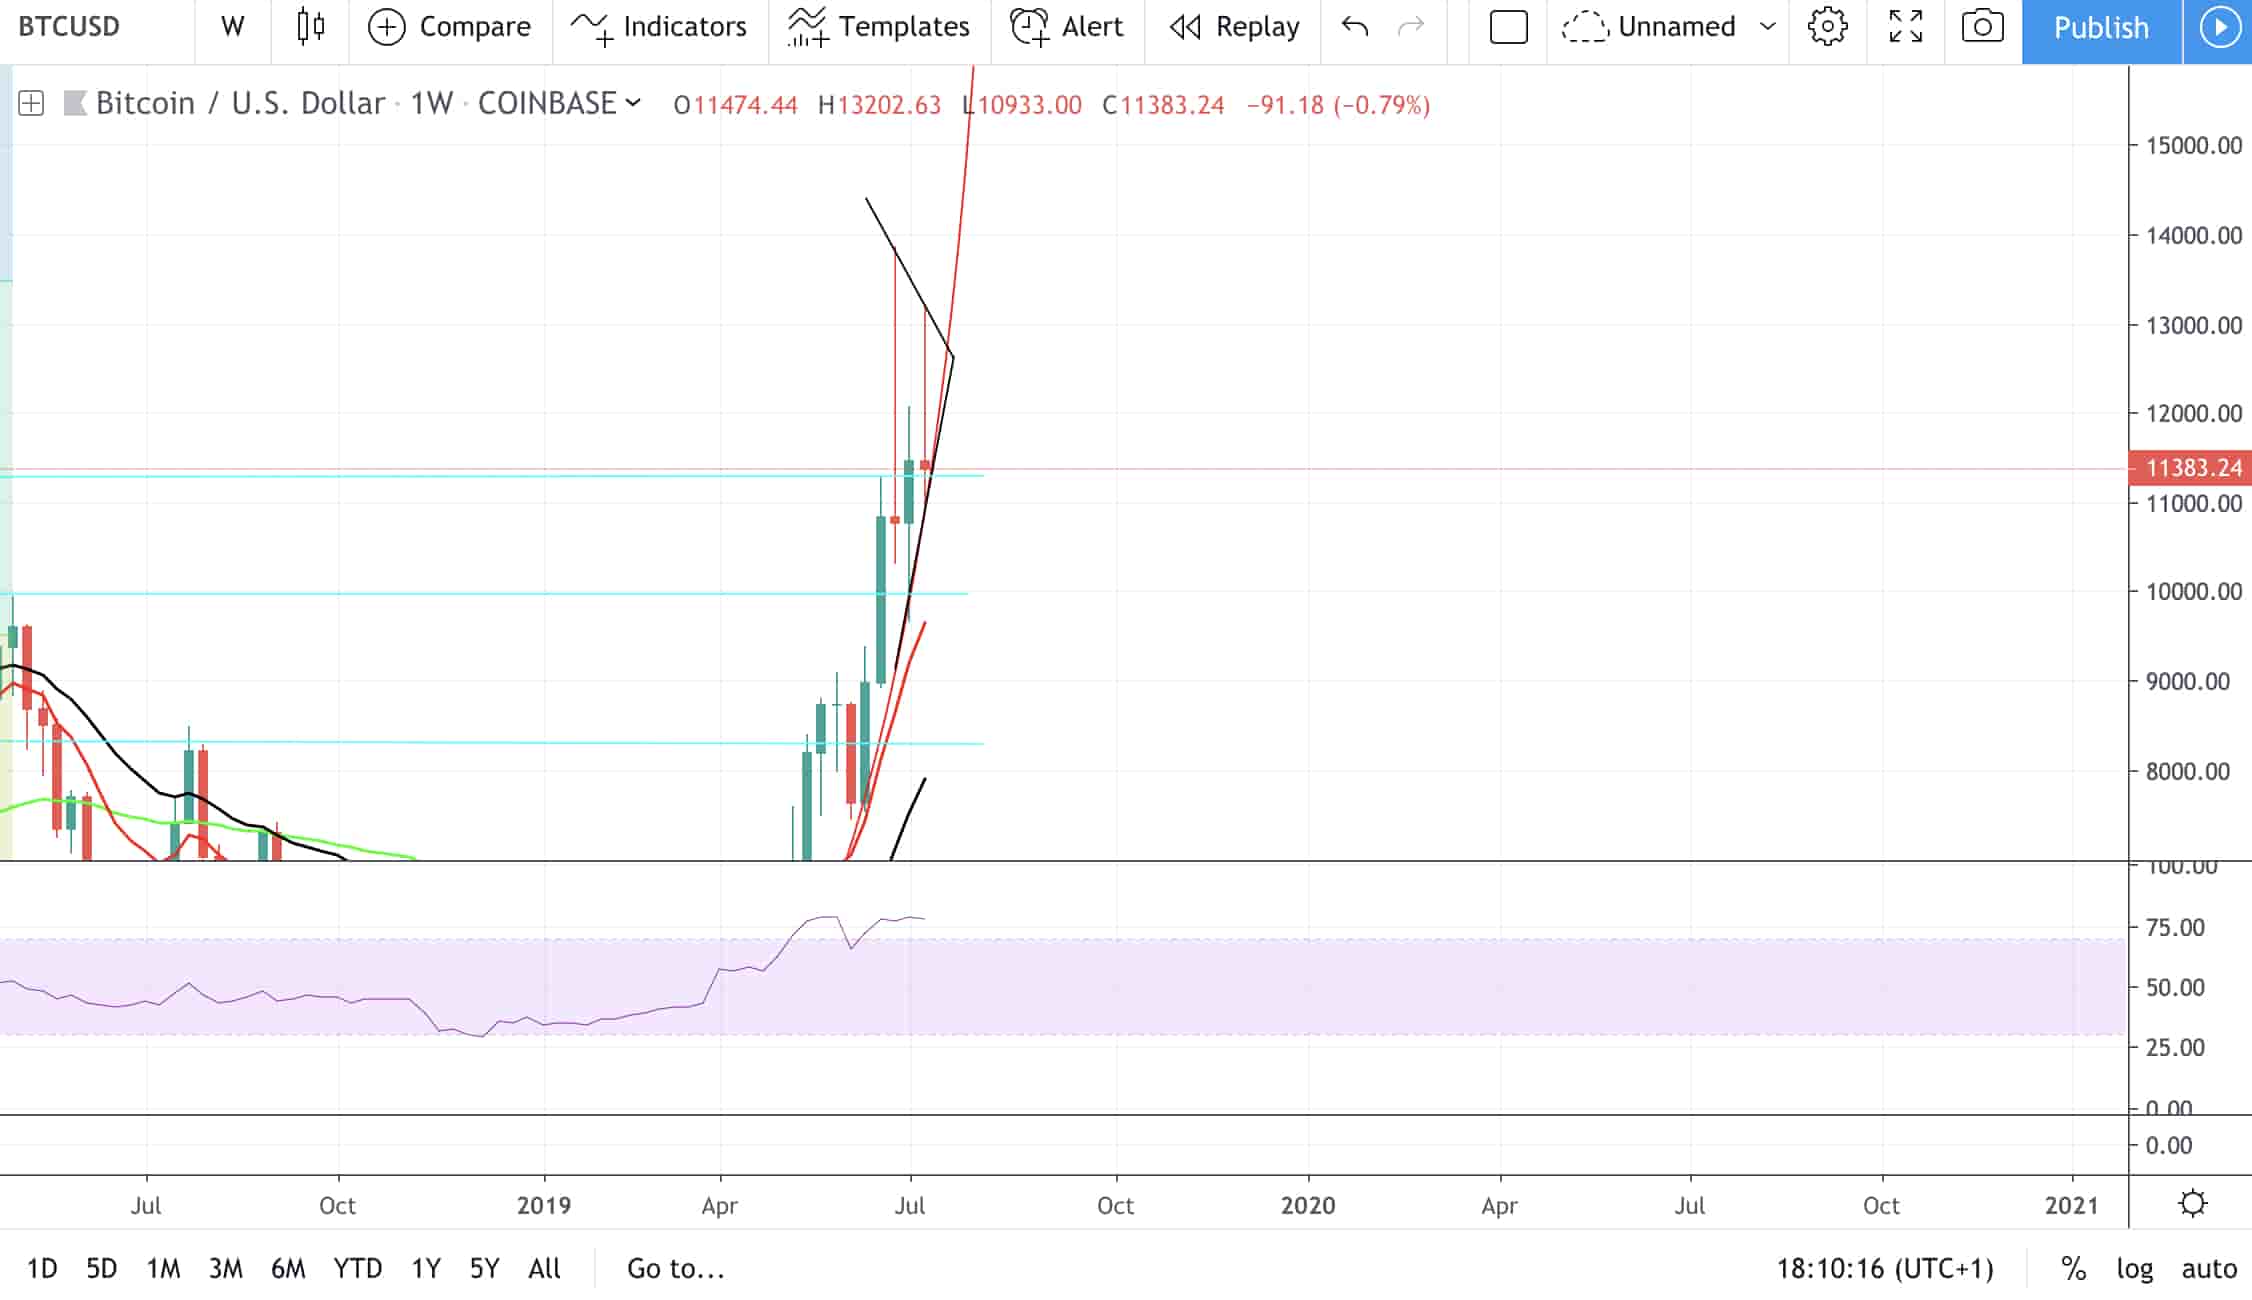
If we have a look at the weekly chart we could pretty much say, with a 70% accuracy, BTC will close with a bearish shooting star pattern, however, BTC seems to do exactly the opposite of what the candle patterns mean; a good sign in my opinion, so there is nothing to worry about just yet.
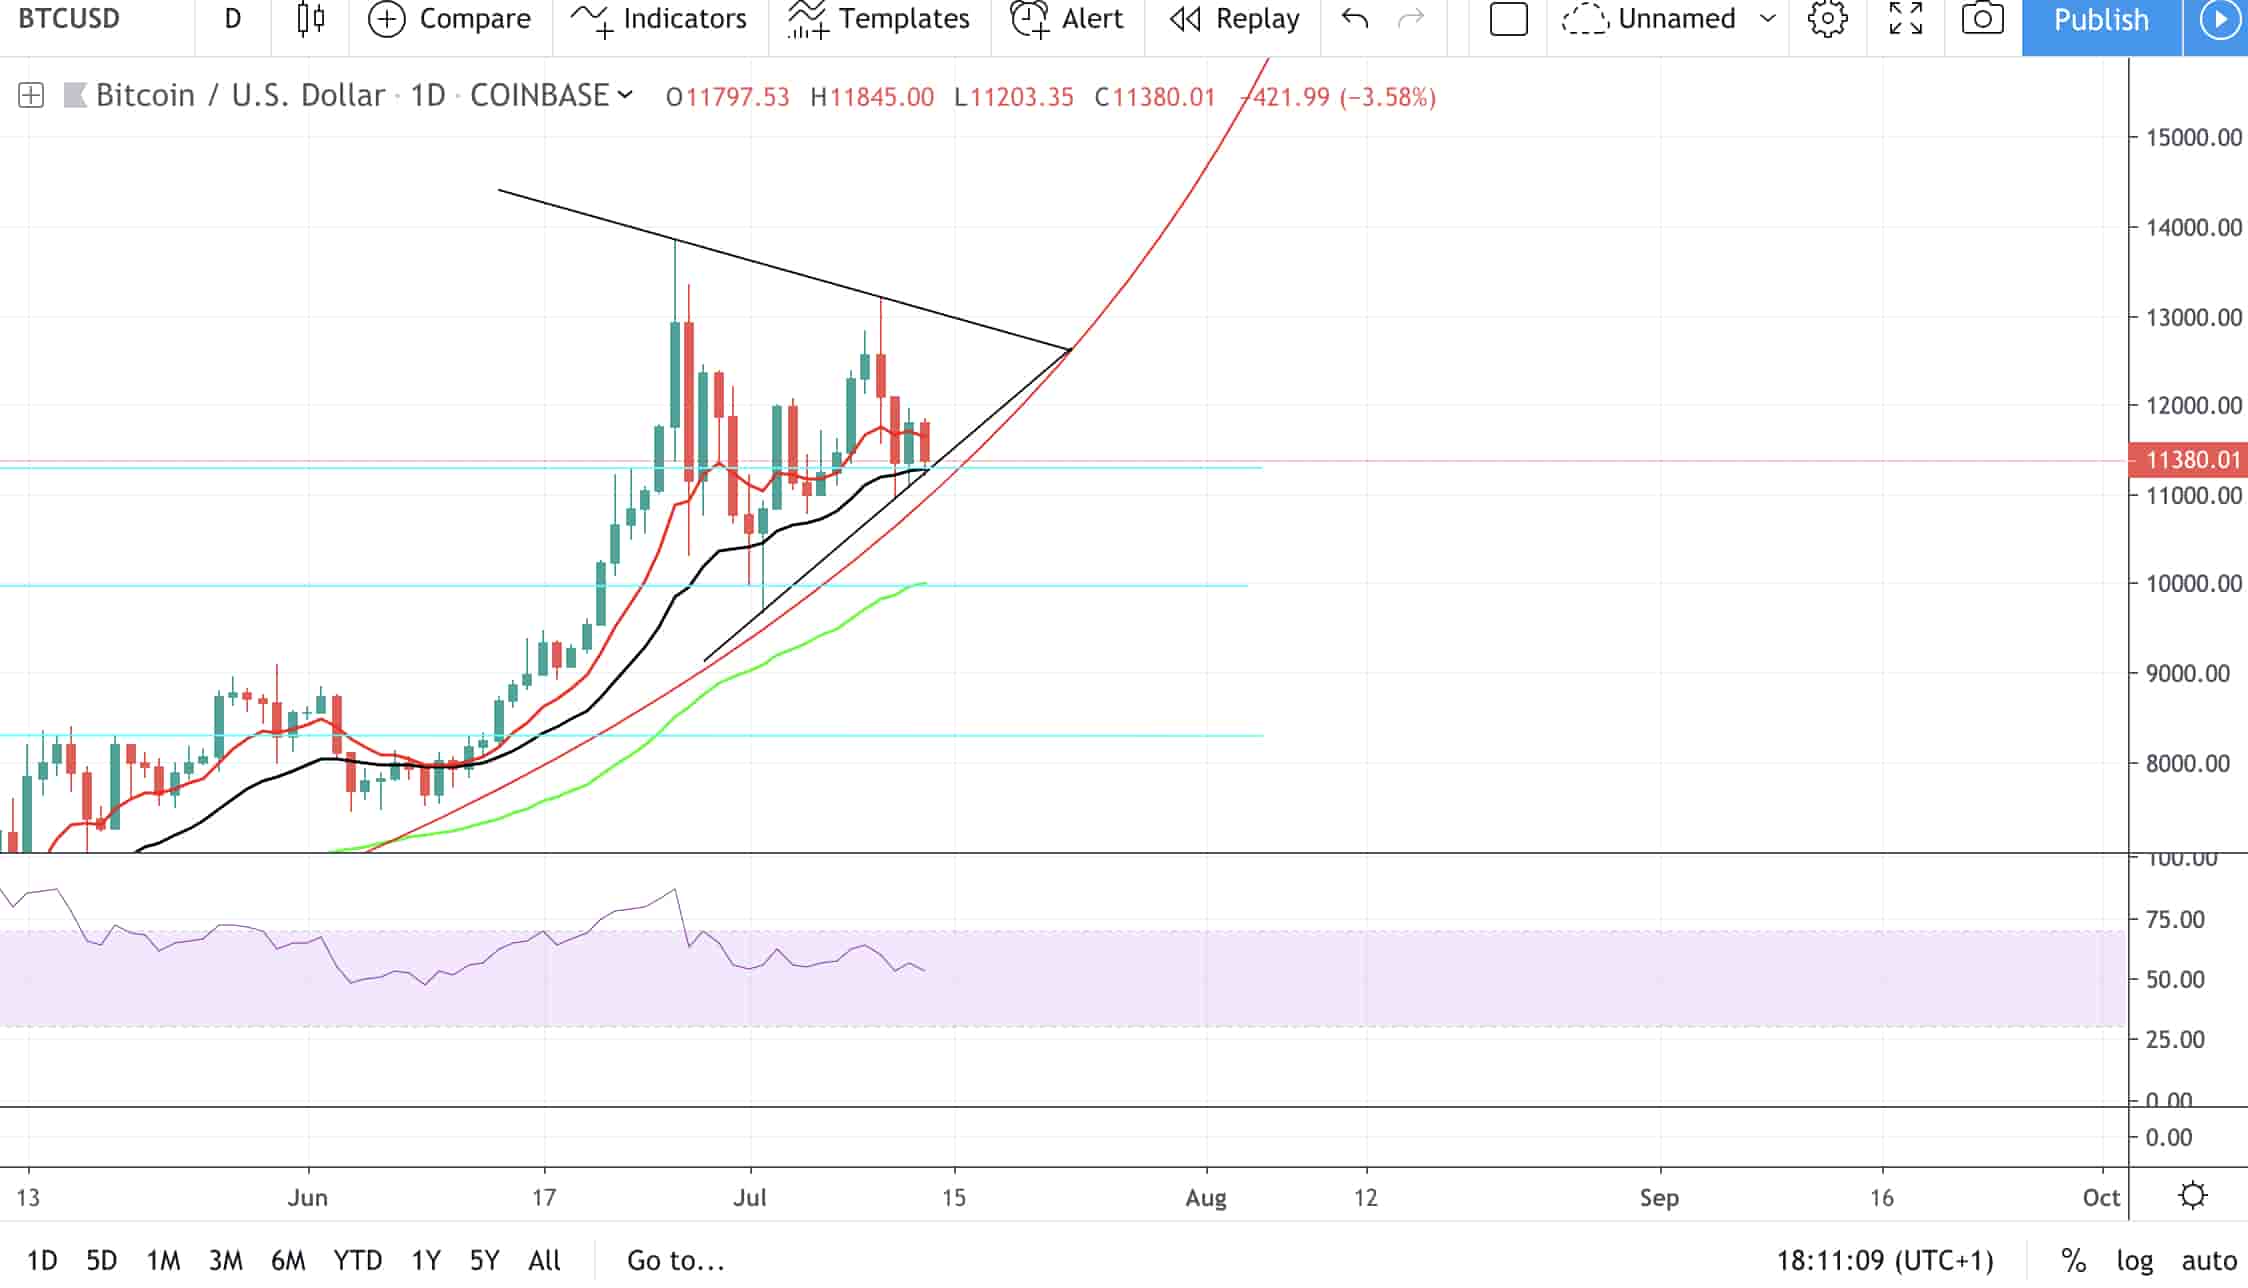
Going to the daily chart, we can see that BTC is following the parabolic curve, and we can also see a bullish triangle (or a pennant).
So far so good, the current level seems to be holding pretty well.
If we break below $11,300, we might see a flash retest of around $10,000 and maybe even end up with a descending bullish triangle. If that happens, BTC might break below the parabolic curve and it could be very bearish if it closes like that. In other words, if BTC closes below $11,000 tomorrow, I think it could be very bad in terms of price.
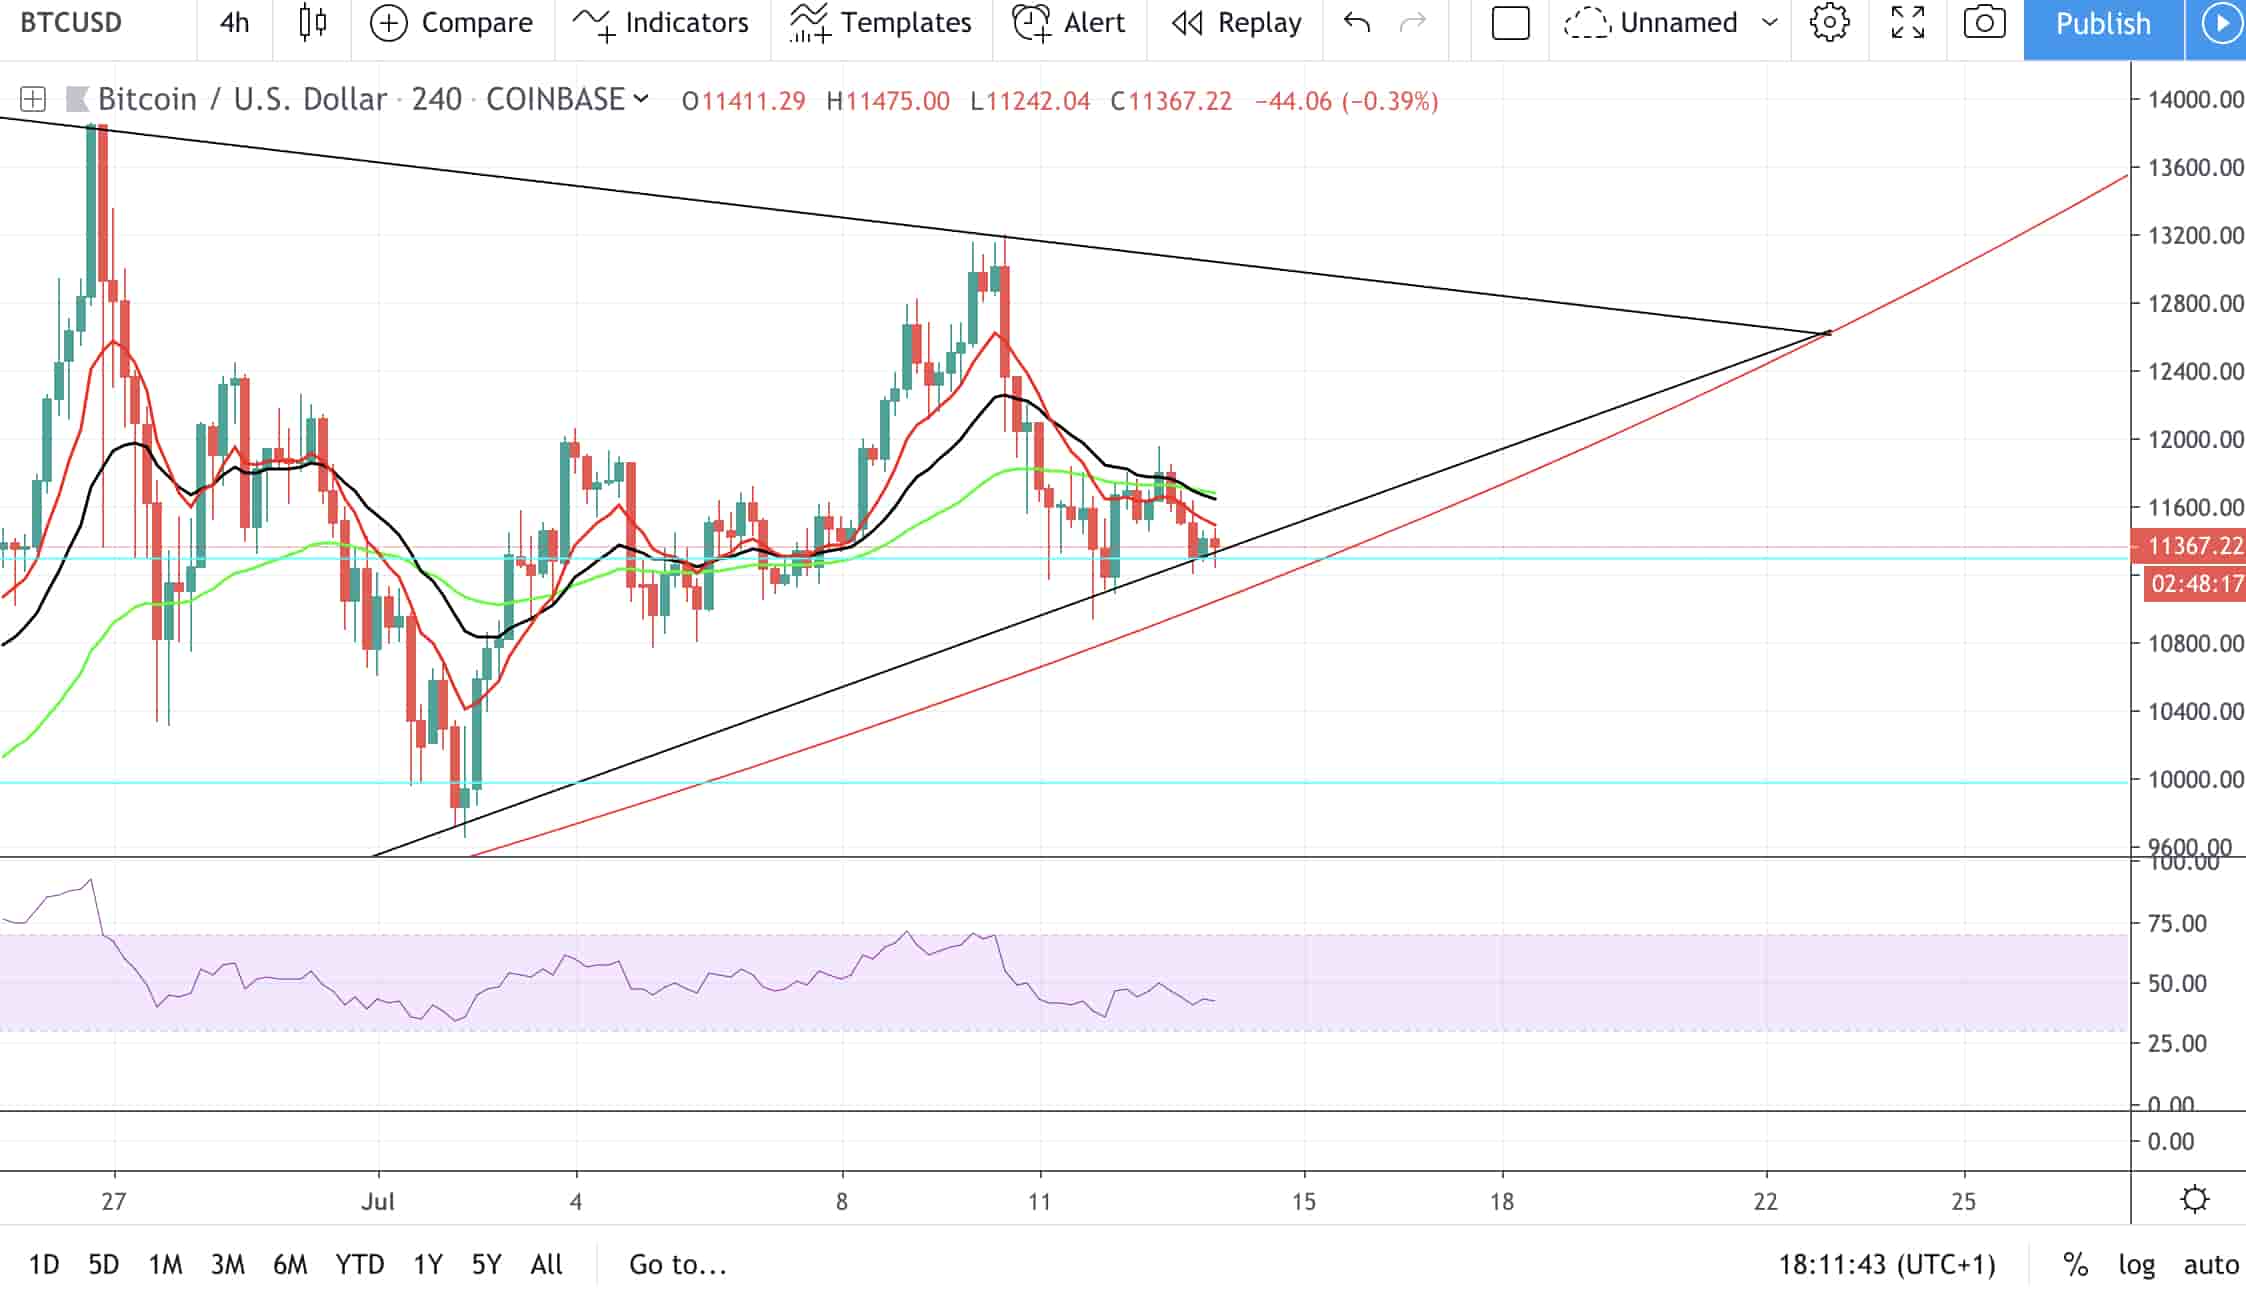
By looking at the 4-hour chart, we can see a bottom in place. I’d expect a push up which should result in a bullish EMA (9&20) cross as well.
BTC looks like it is consolidating and I want to be bullish on it, but be wary of the risks.
What’s the target if BTC is continuing in the uptrend?
If the uptrend continues, a safe target would be somewhere around $17,200-300. That’s where I would expect a major correction.
You need help to understand all the technical analysis and trading terms? Click here.
Please Note: This is not financial advice, it’s just me expressing my own opinion over the market. Please do your own due diligence before investing in such volatile markets.


