


")


 Tokens Playing This P2E Game")

While I believe BTC needs to have a correction eventually, I don’t think it will happen that soon, instead, I’d expect it to spike through the next resistance level. Let’s summon the charts!
BTC/USD Short-Term Chart Analysis
- Current Price on CoinGecko at the moment of writing this article: $5270
- Resistance levels: $5344, $5666, $6100-6200
- Support levels: $4900, $4600-4700
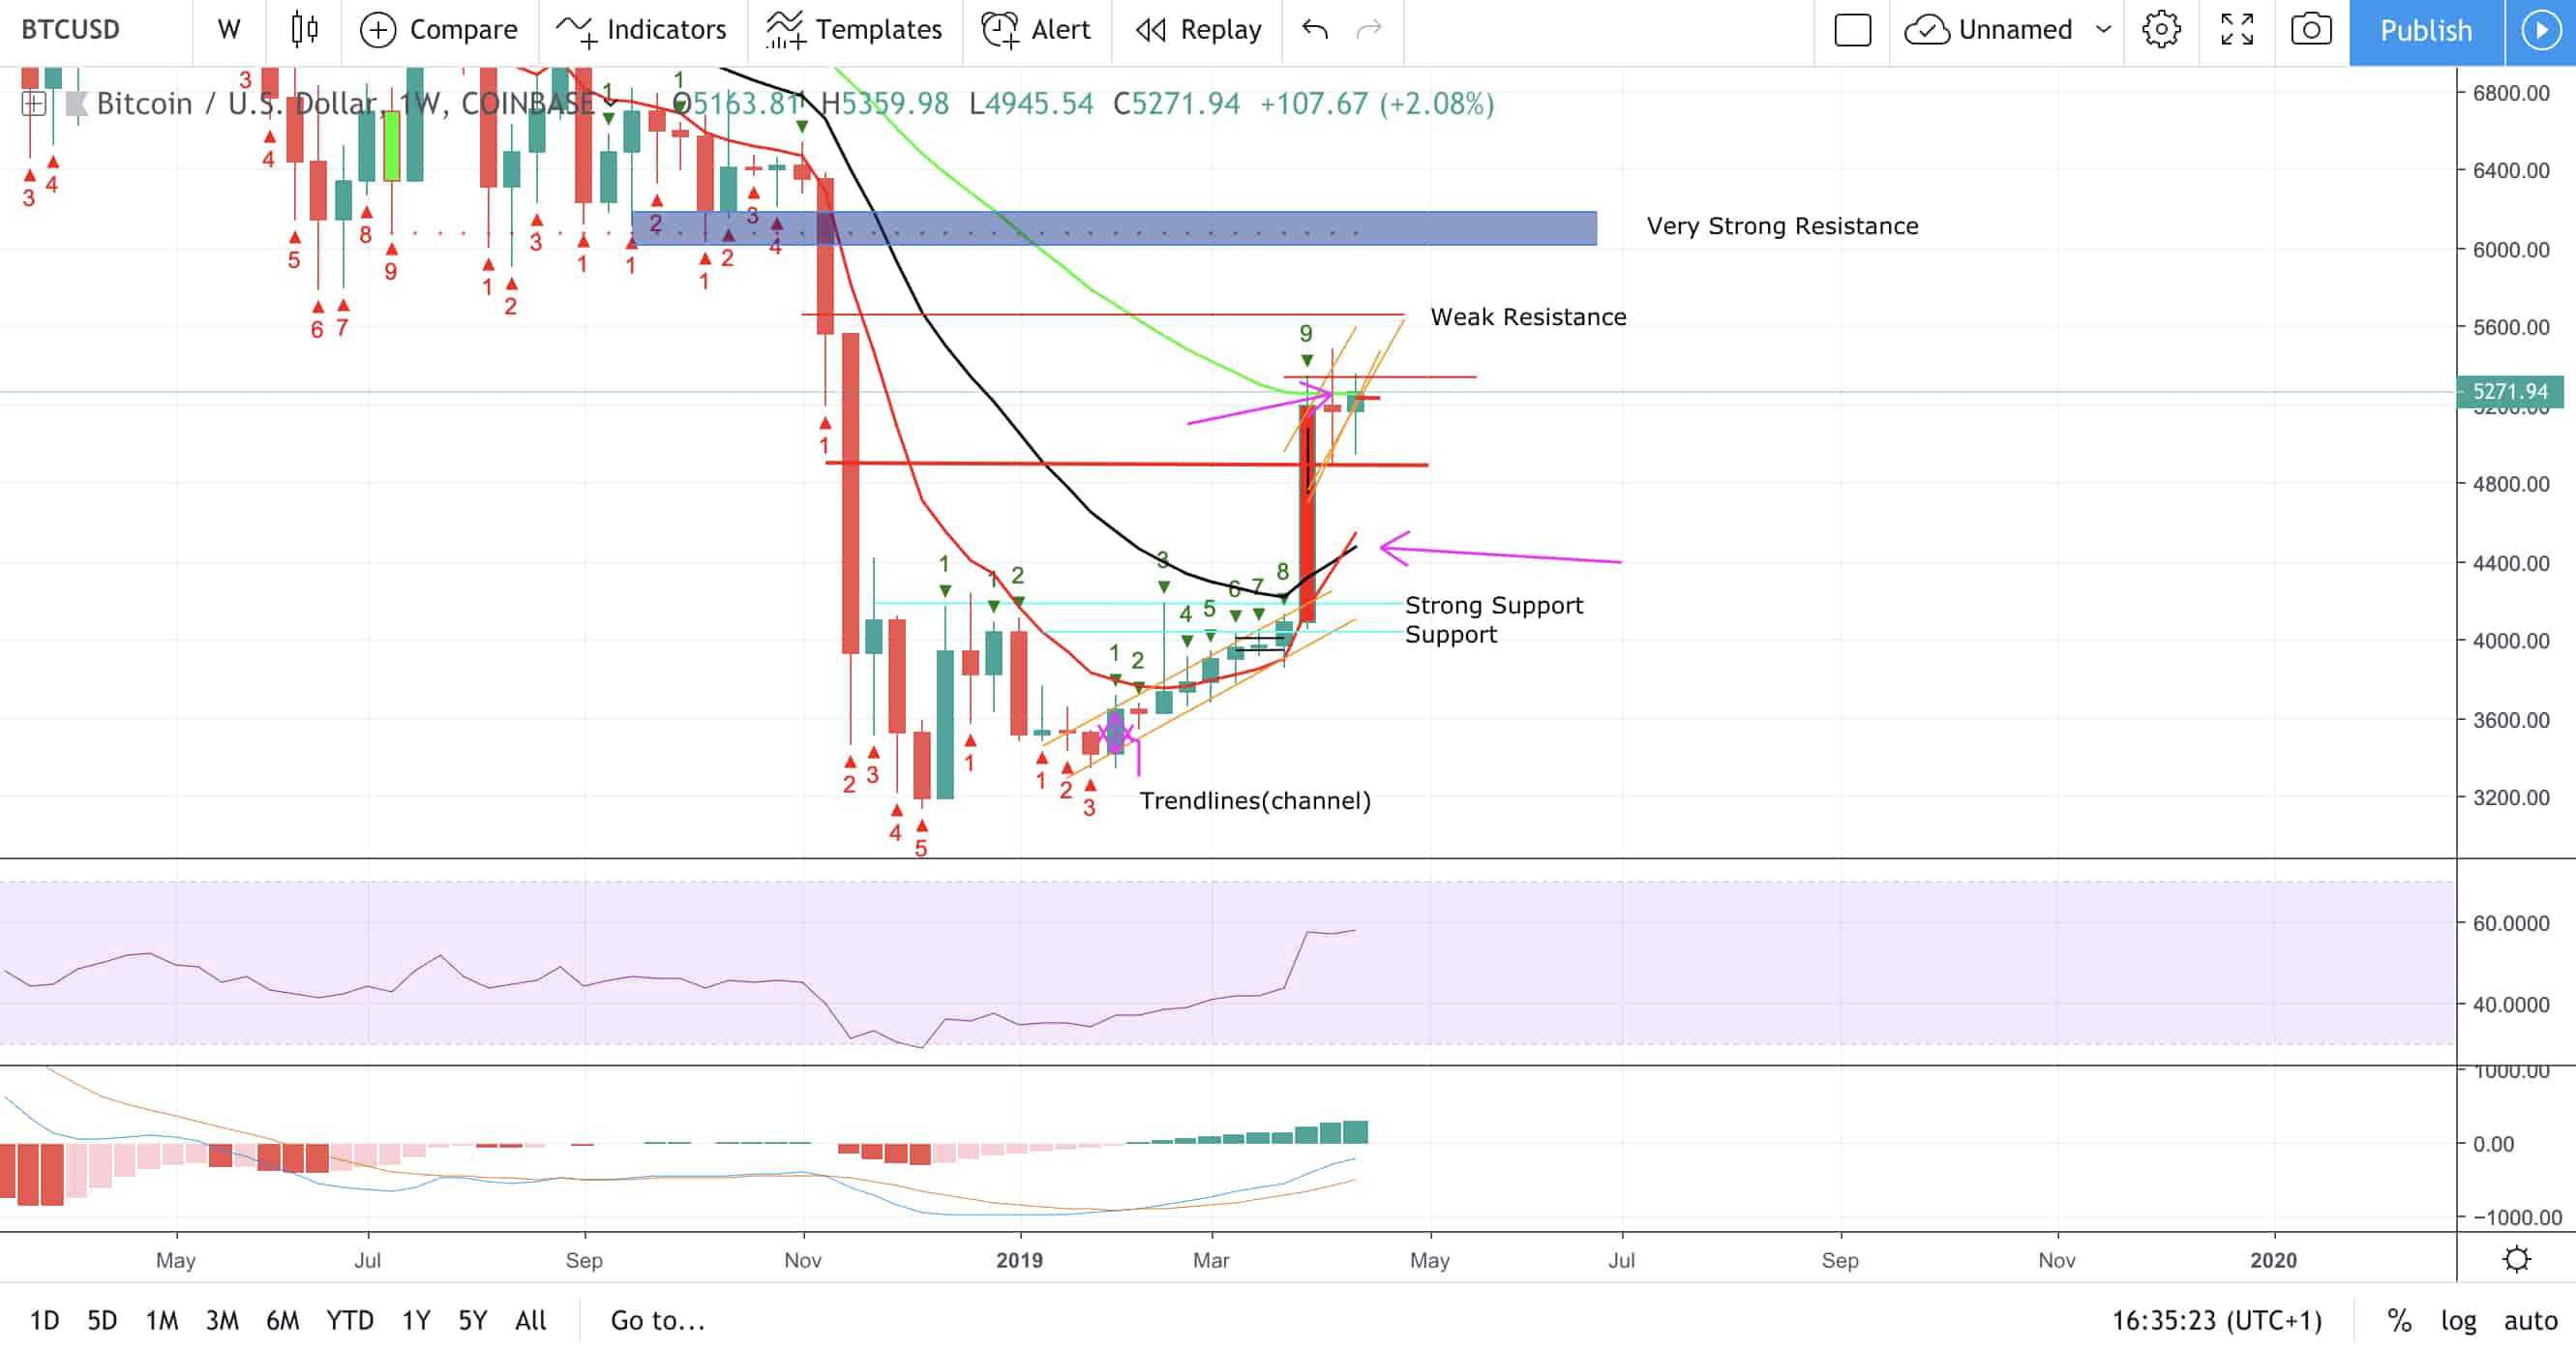
By analyzing the weekly chart, I can see a few bull signs. BTC is currently above the 50EMA, which acts as resistance. Another bull indicator to look at is a crossover of the 9 & 20 EMAs (black and red EMAs).
If the weekly chart closes in the bull’s favor, it will make a bull hammer right above the resistance (green EMA).
I don’t think BTC had a big enough correction judging by the TD indicator on the weekly chart, however, I’d say it’s not something we should worry about at the moment.
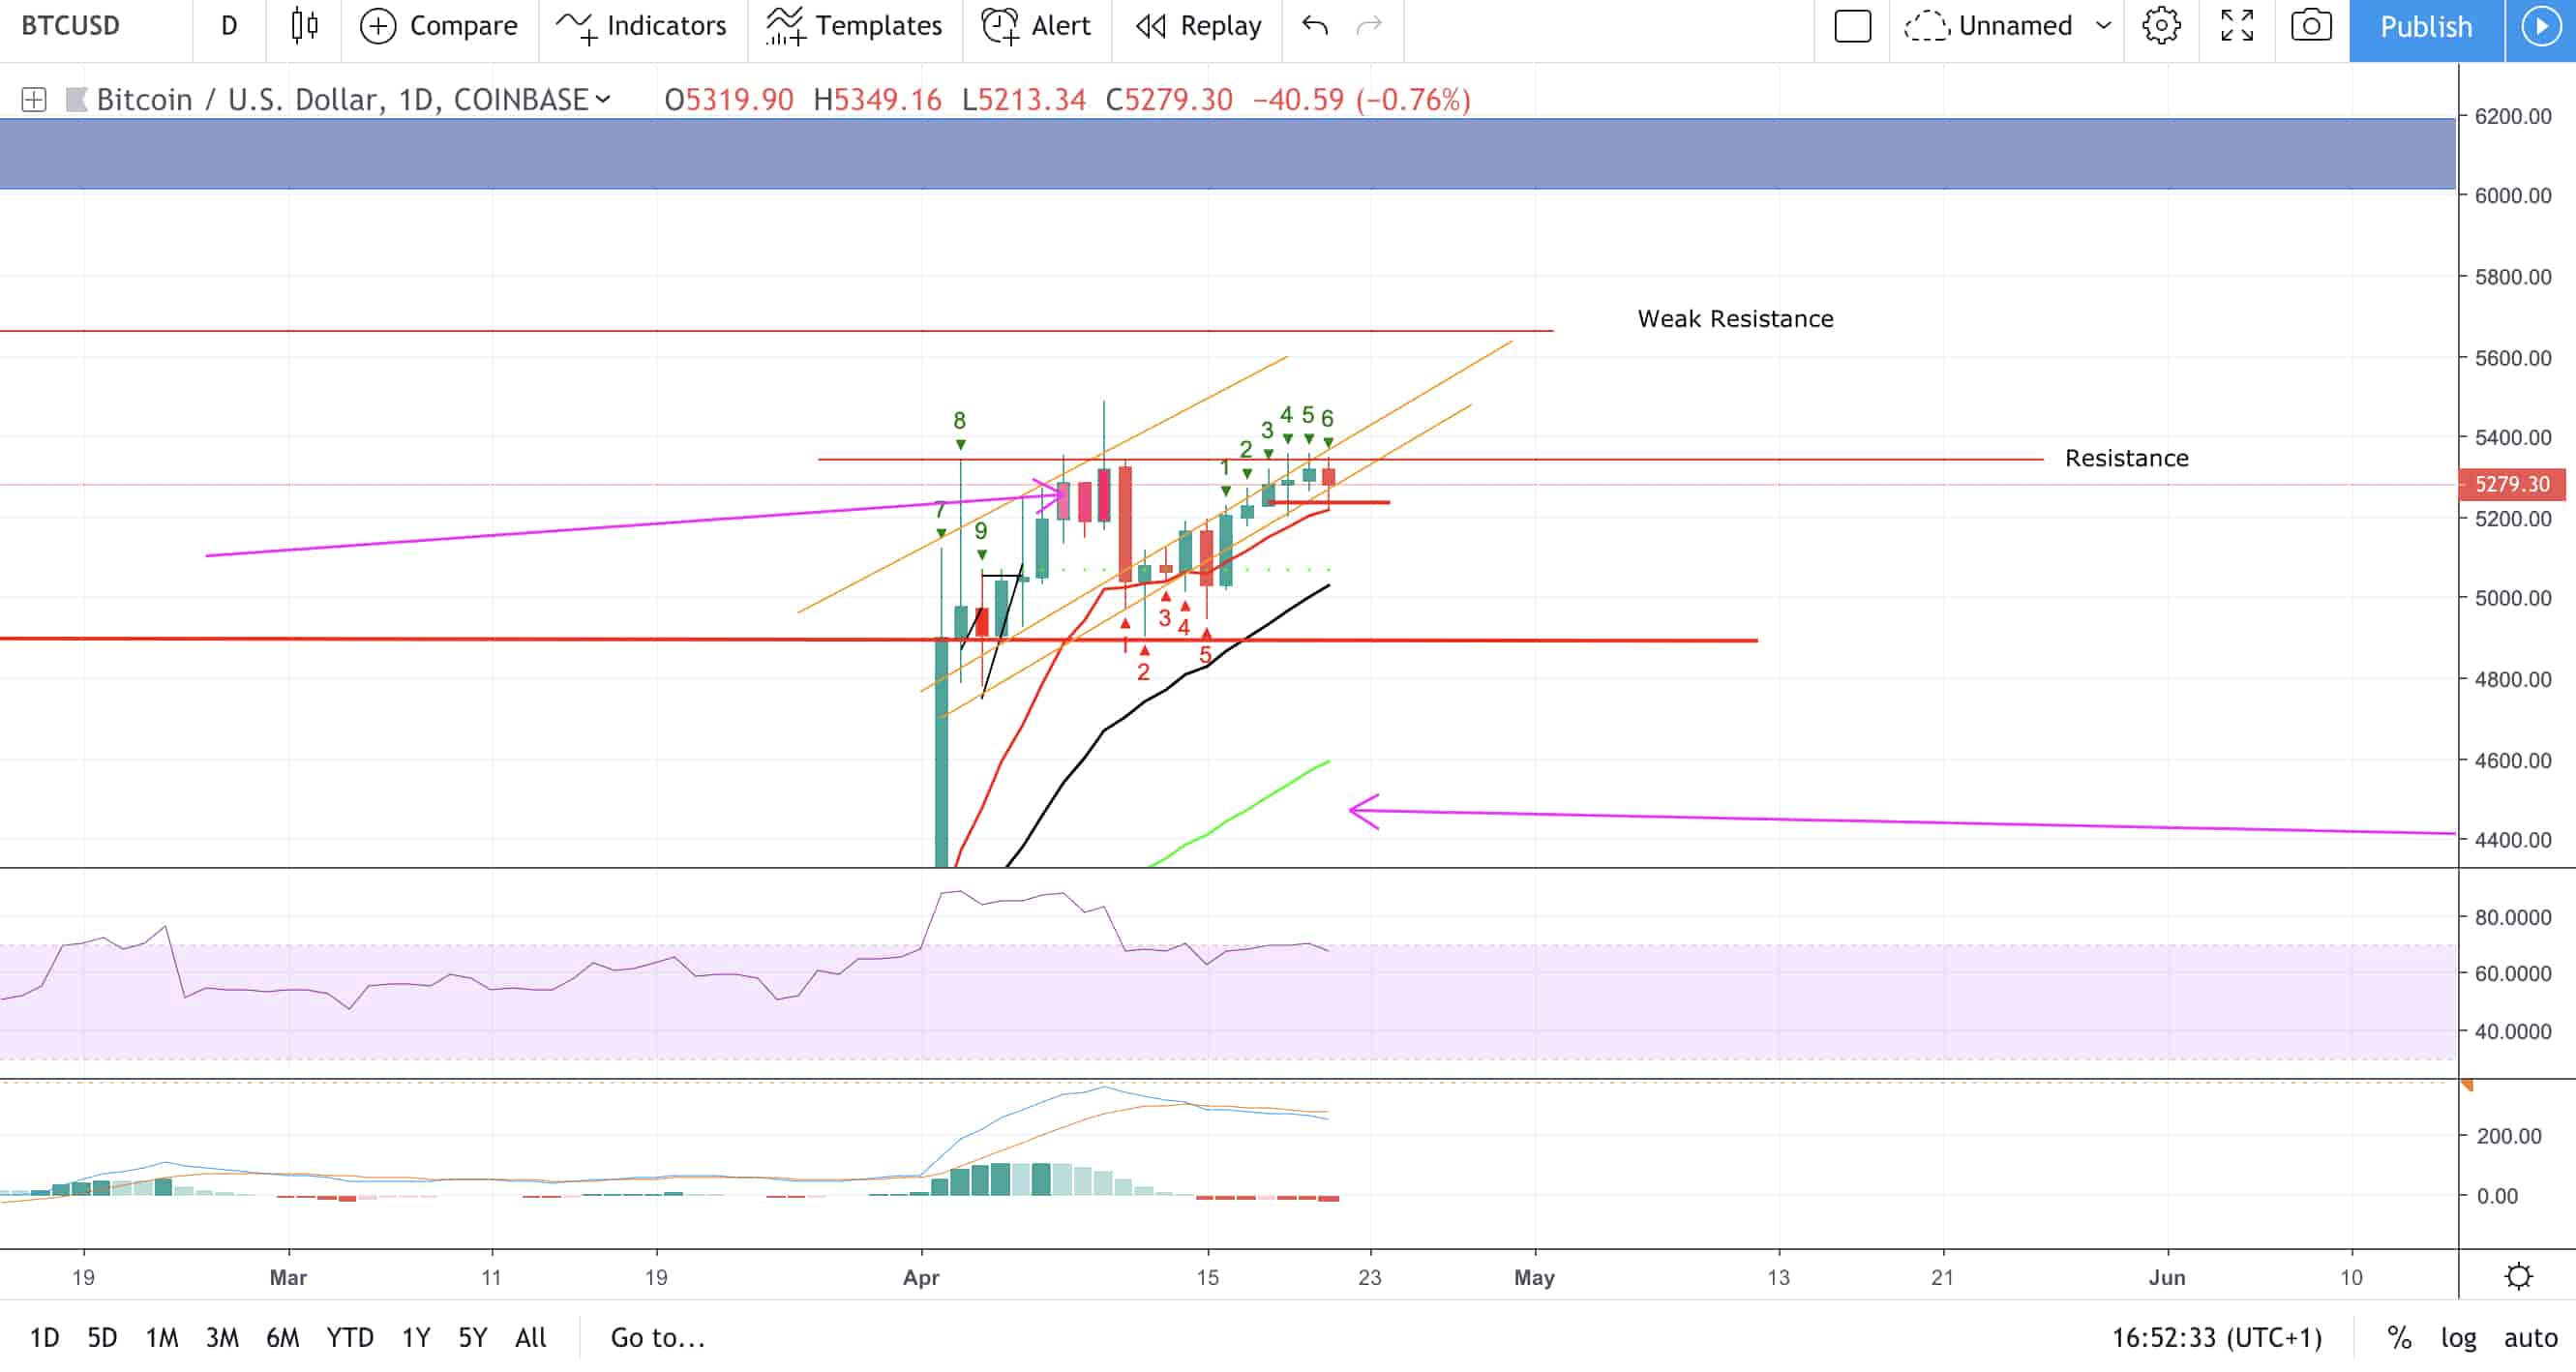
The 1-day chart looks pretty good as well. BTC is staying just below the overbought area on the RSI indicator for a couple of days now and is currently in the trading channel. It wants to go up.
How I see BTC short-term:
It will go to test the $5666 price level and break it. BTC will continue to gain value until it touches the $6100-6200 area (the weekly RSI will indicate heavily overbought), followed by a correction to $5400-5600. After that correction, I’d expect the creation of a cup and handle pattern, followed by a continuation of the Bull Run.
Note: Please, keep in mind that this is not financial advice, it is just me sharing my opinion. I am not a financial advisor. Always make sure to do your own due diligence before investing.


nice analyse Robert .lets hope your right