


")


 Tokens Playing This P2E Game")

Bitcoin went from bullish to bearish pretty quick, and the situation isn’t looking great at the moment. Let’s have a look at the charts and discuss what could happen next.
Coinbase – BTC/USD Short-Term Chart Analysis
- Current Price on CoinGecko at the moment of writing this article: $9,500
- Resistance levels: $11,300, $10,000, $17,200-300
- Support levels: $8,300-400
- EMAs: RED 9, BLACK 20, GREEN 50
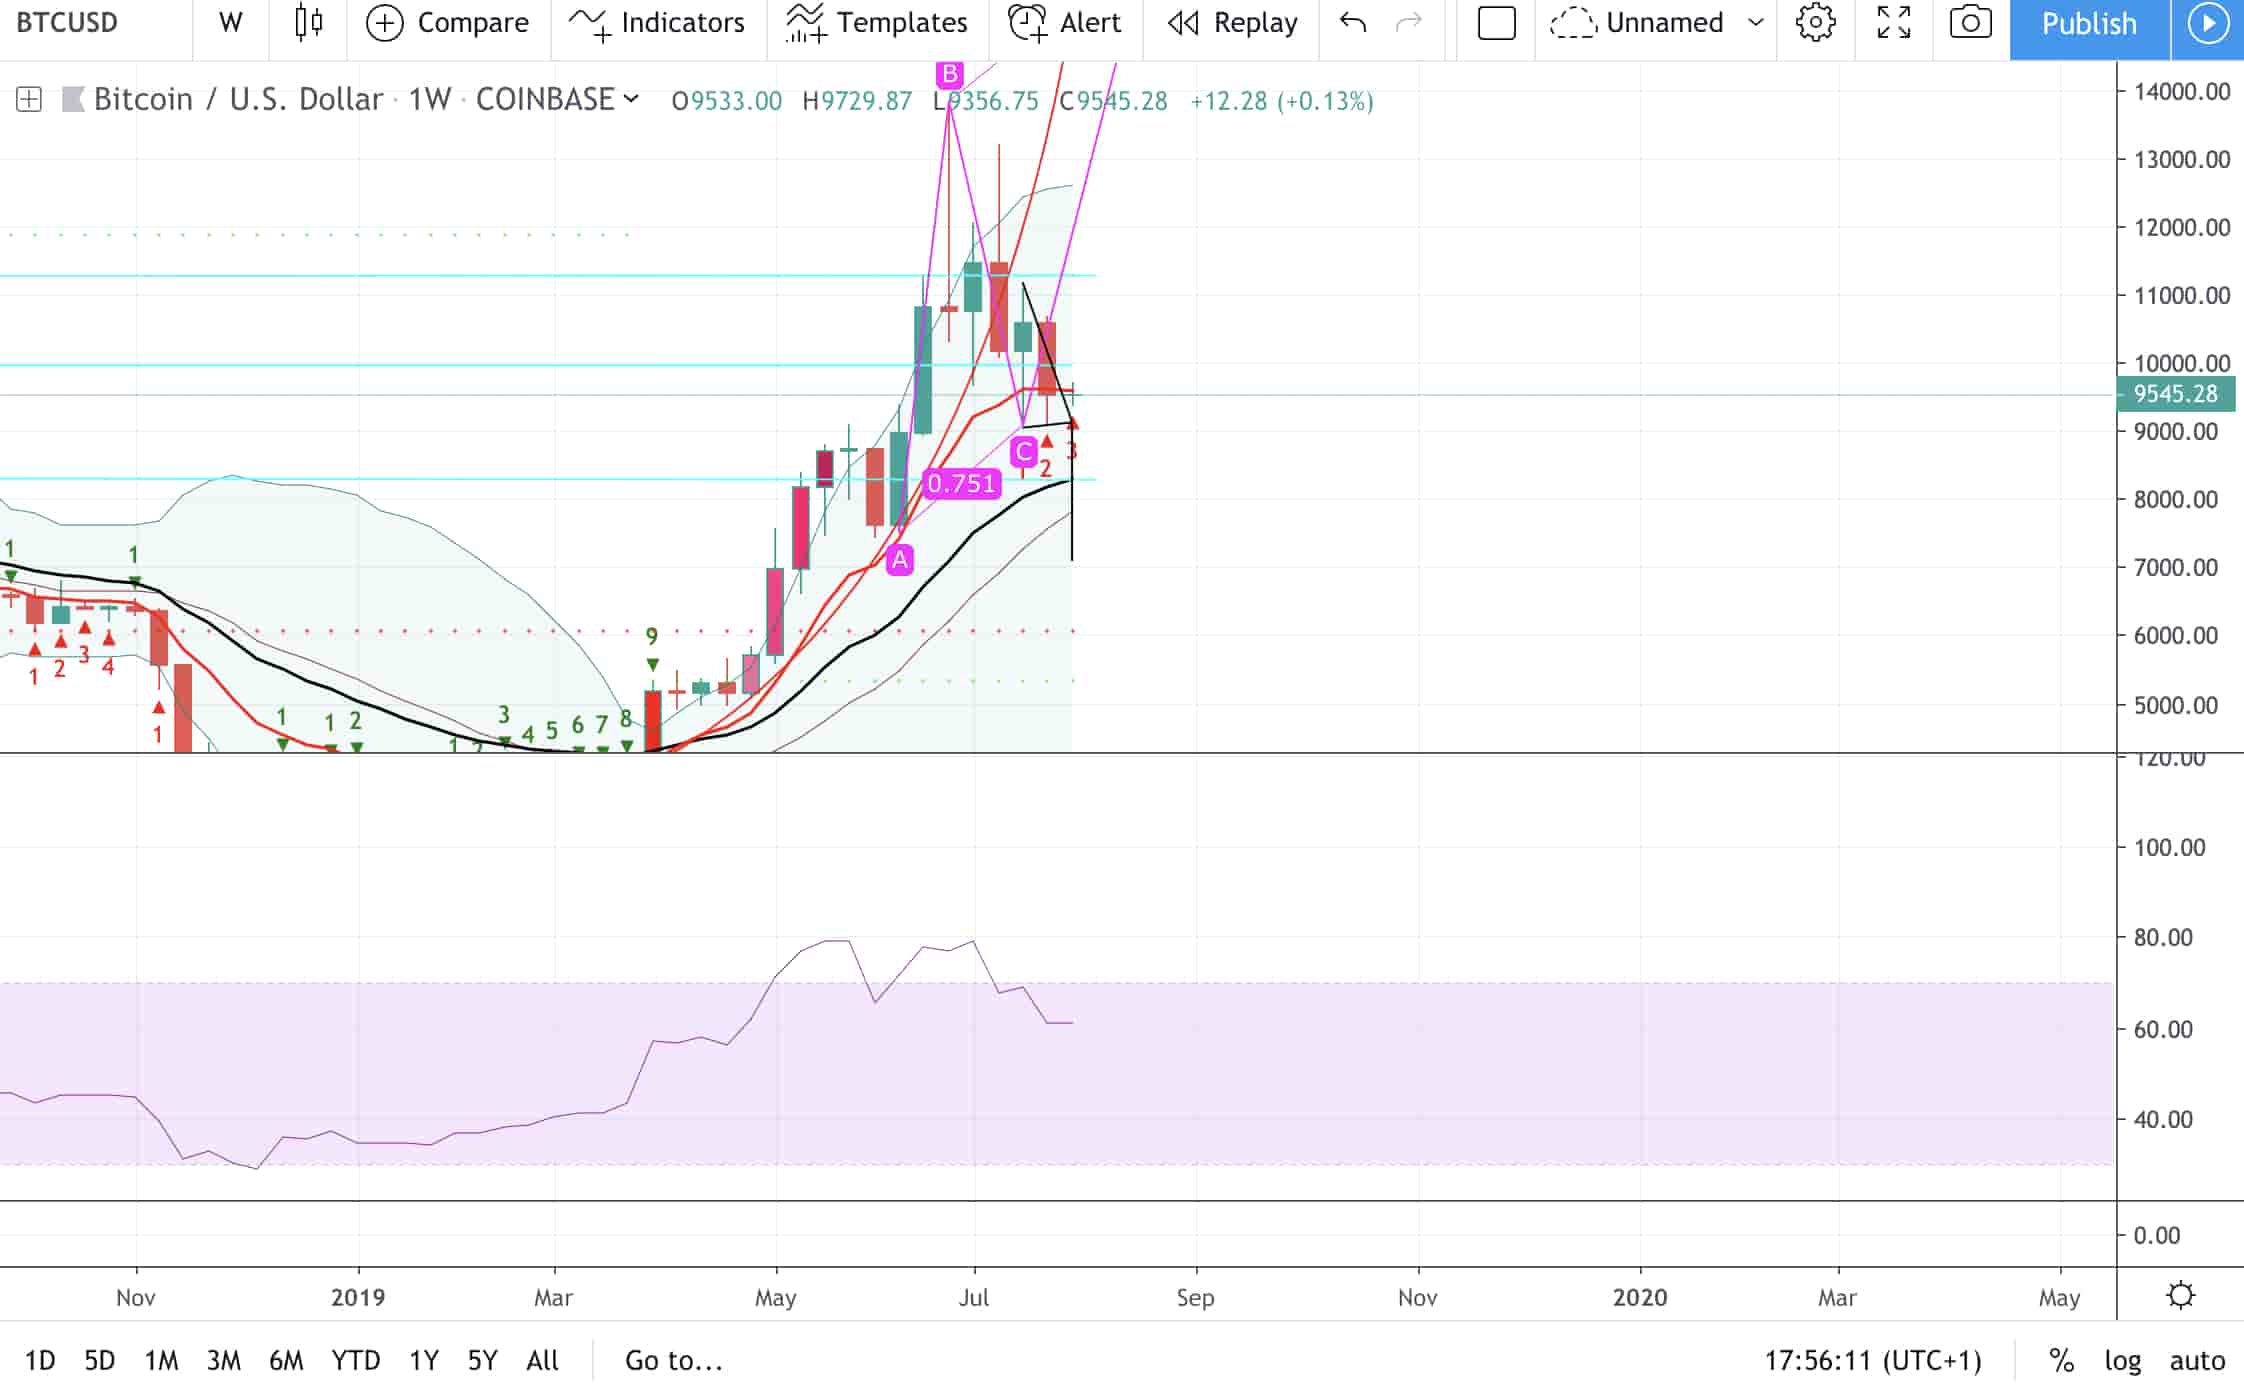
If we look at the weekly chart we can see that we went below the 9-week EMA which could bring us to the next support level of around $8,300, but not necessarily. There have been cases in the past when Bitcoin has fallen below the 9-week EMA without testing the next EMA support.
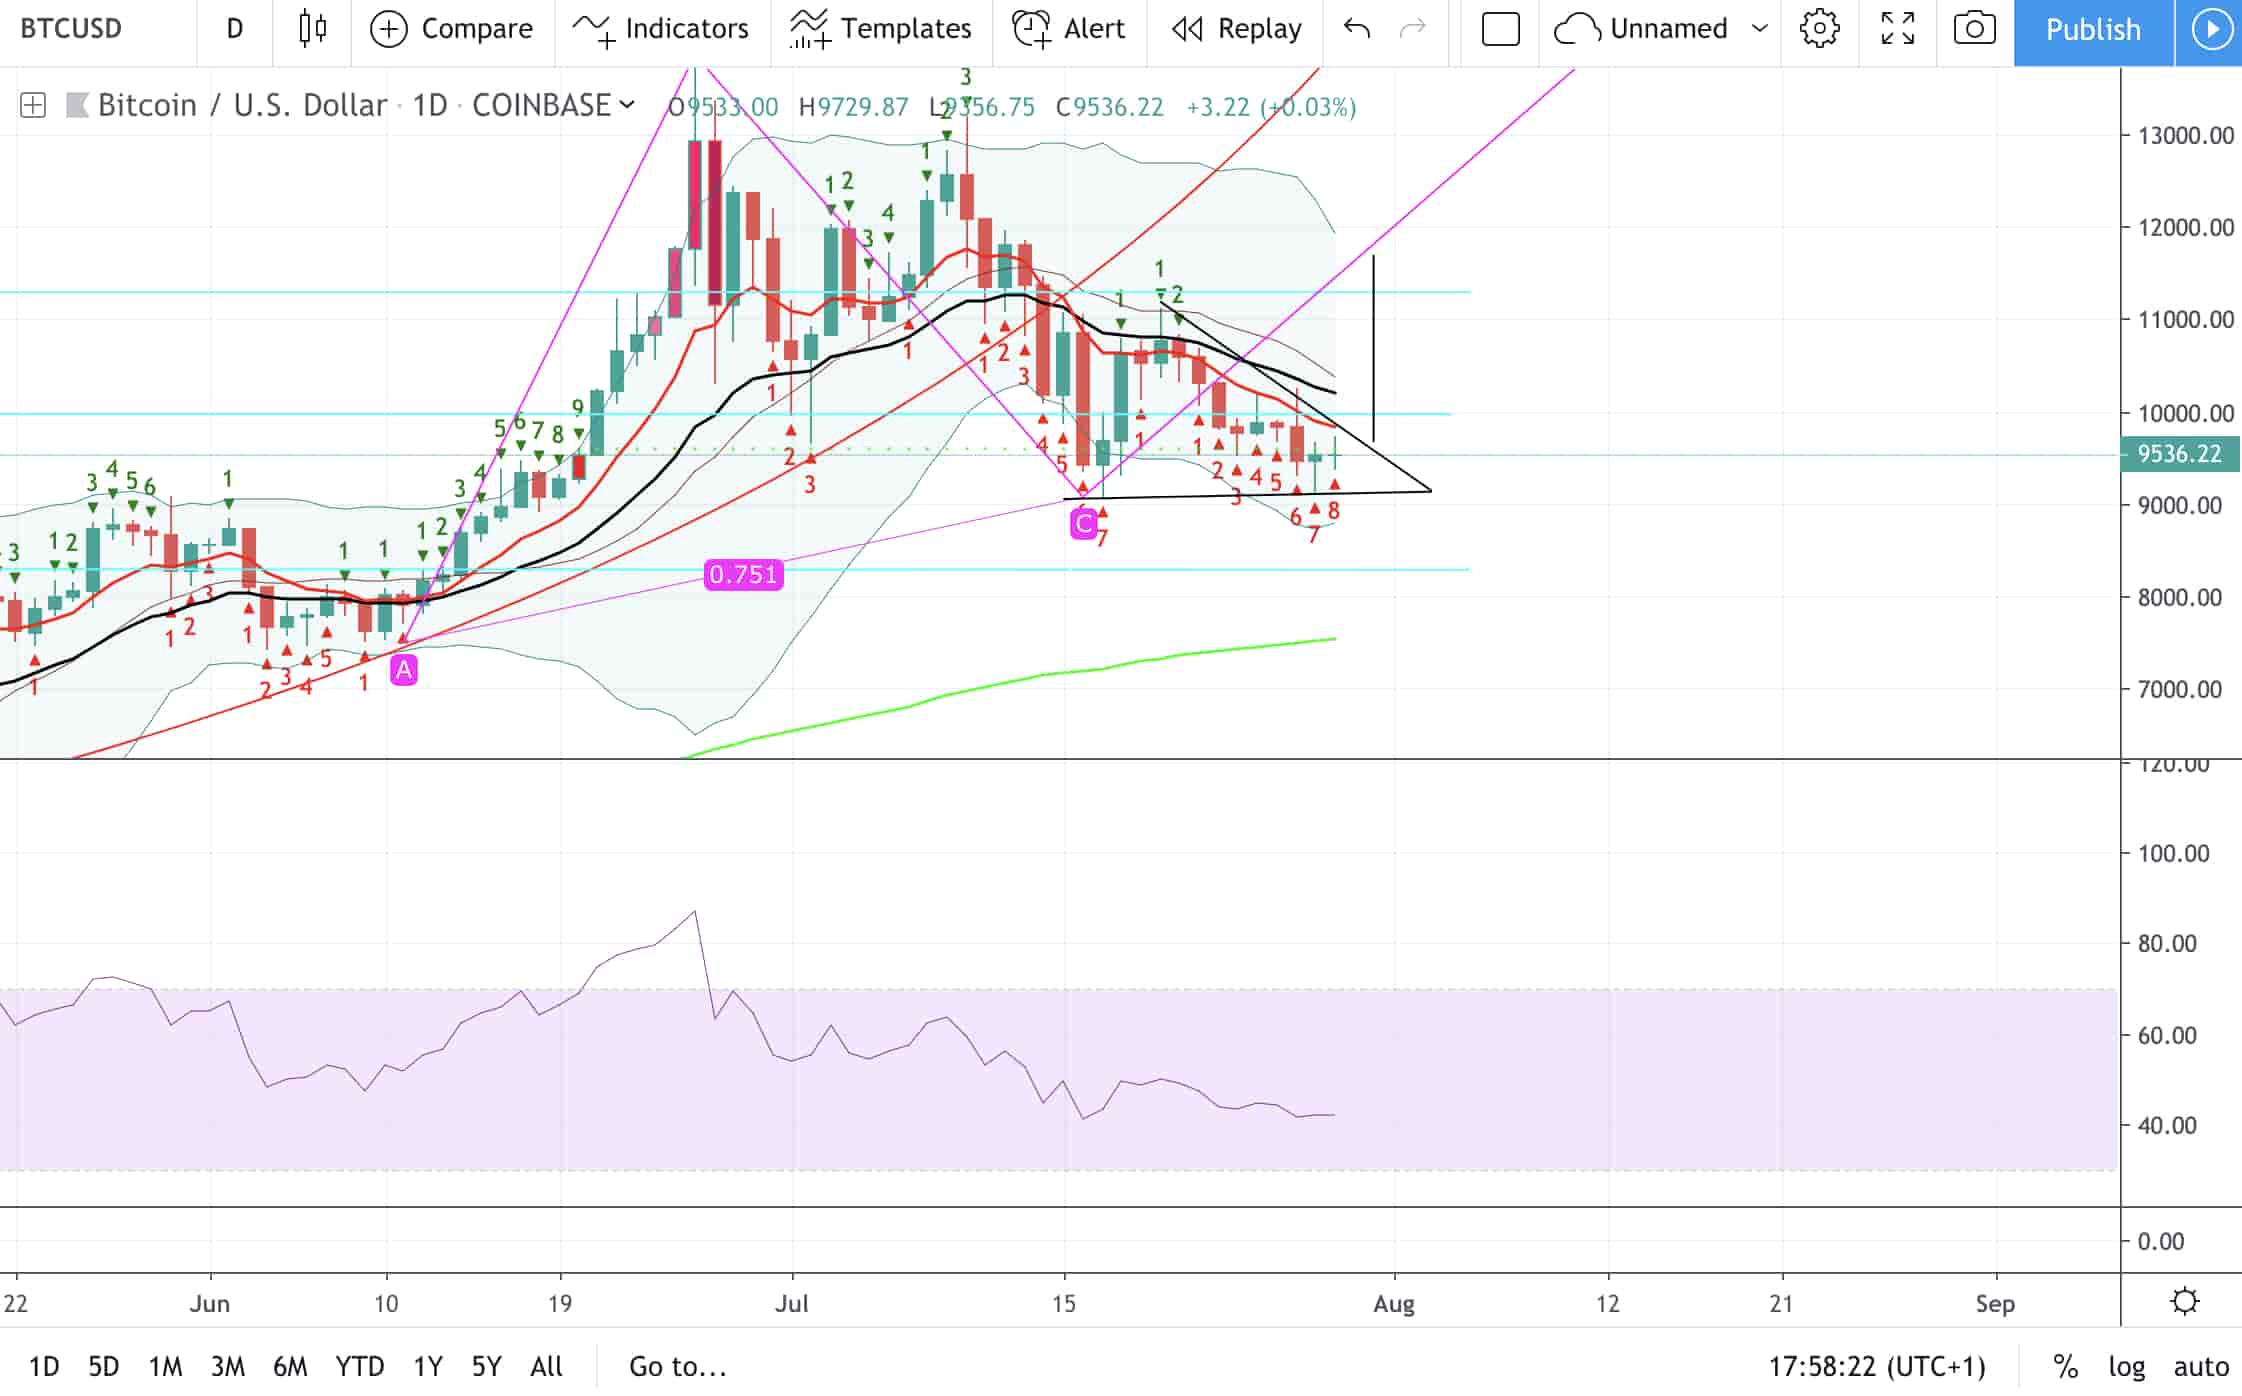
We can see the TD indicator on the daily chart which is close to the 9th count, and an ABCD pattern that could still happen as well as a bear cross of the 9-day EMA with the 50-day EMA, obviously. The price usually corrects itself after we see a 9th TD count on higher timeframes (sometimes sooner or later).
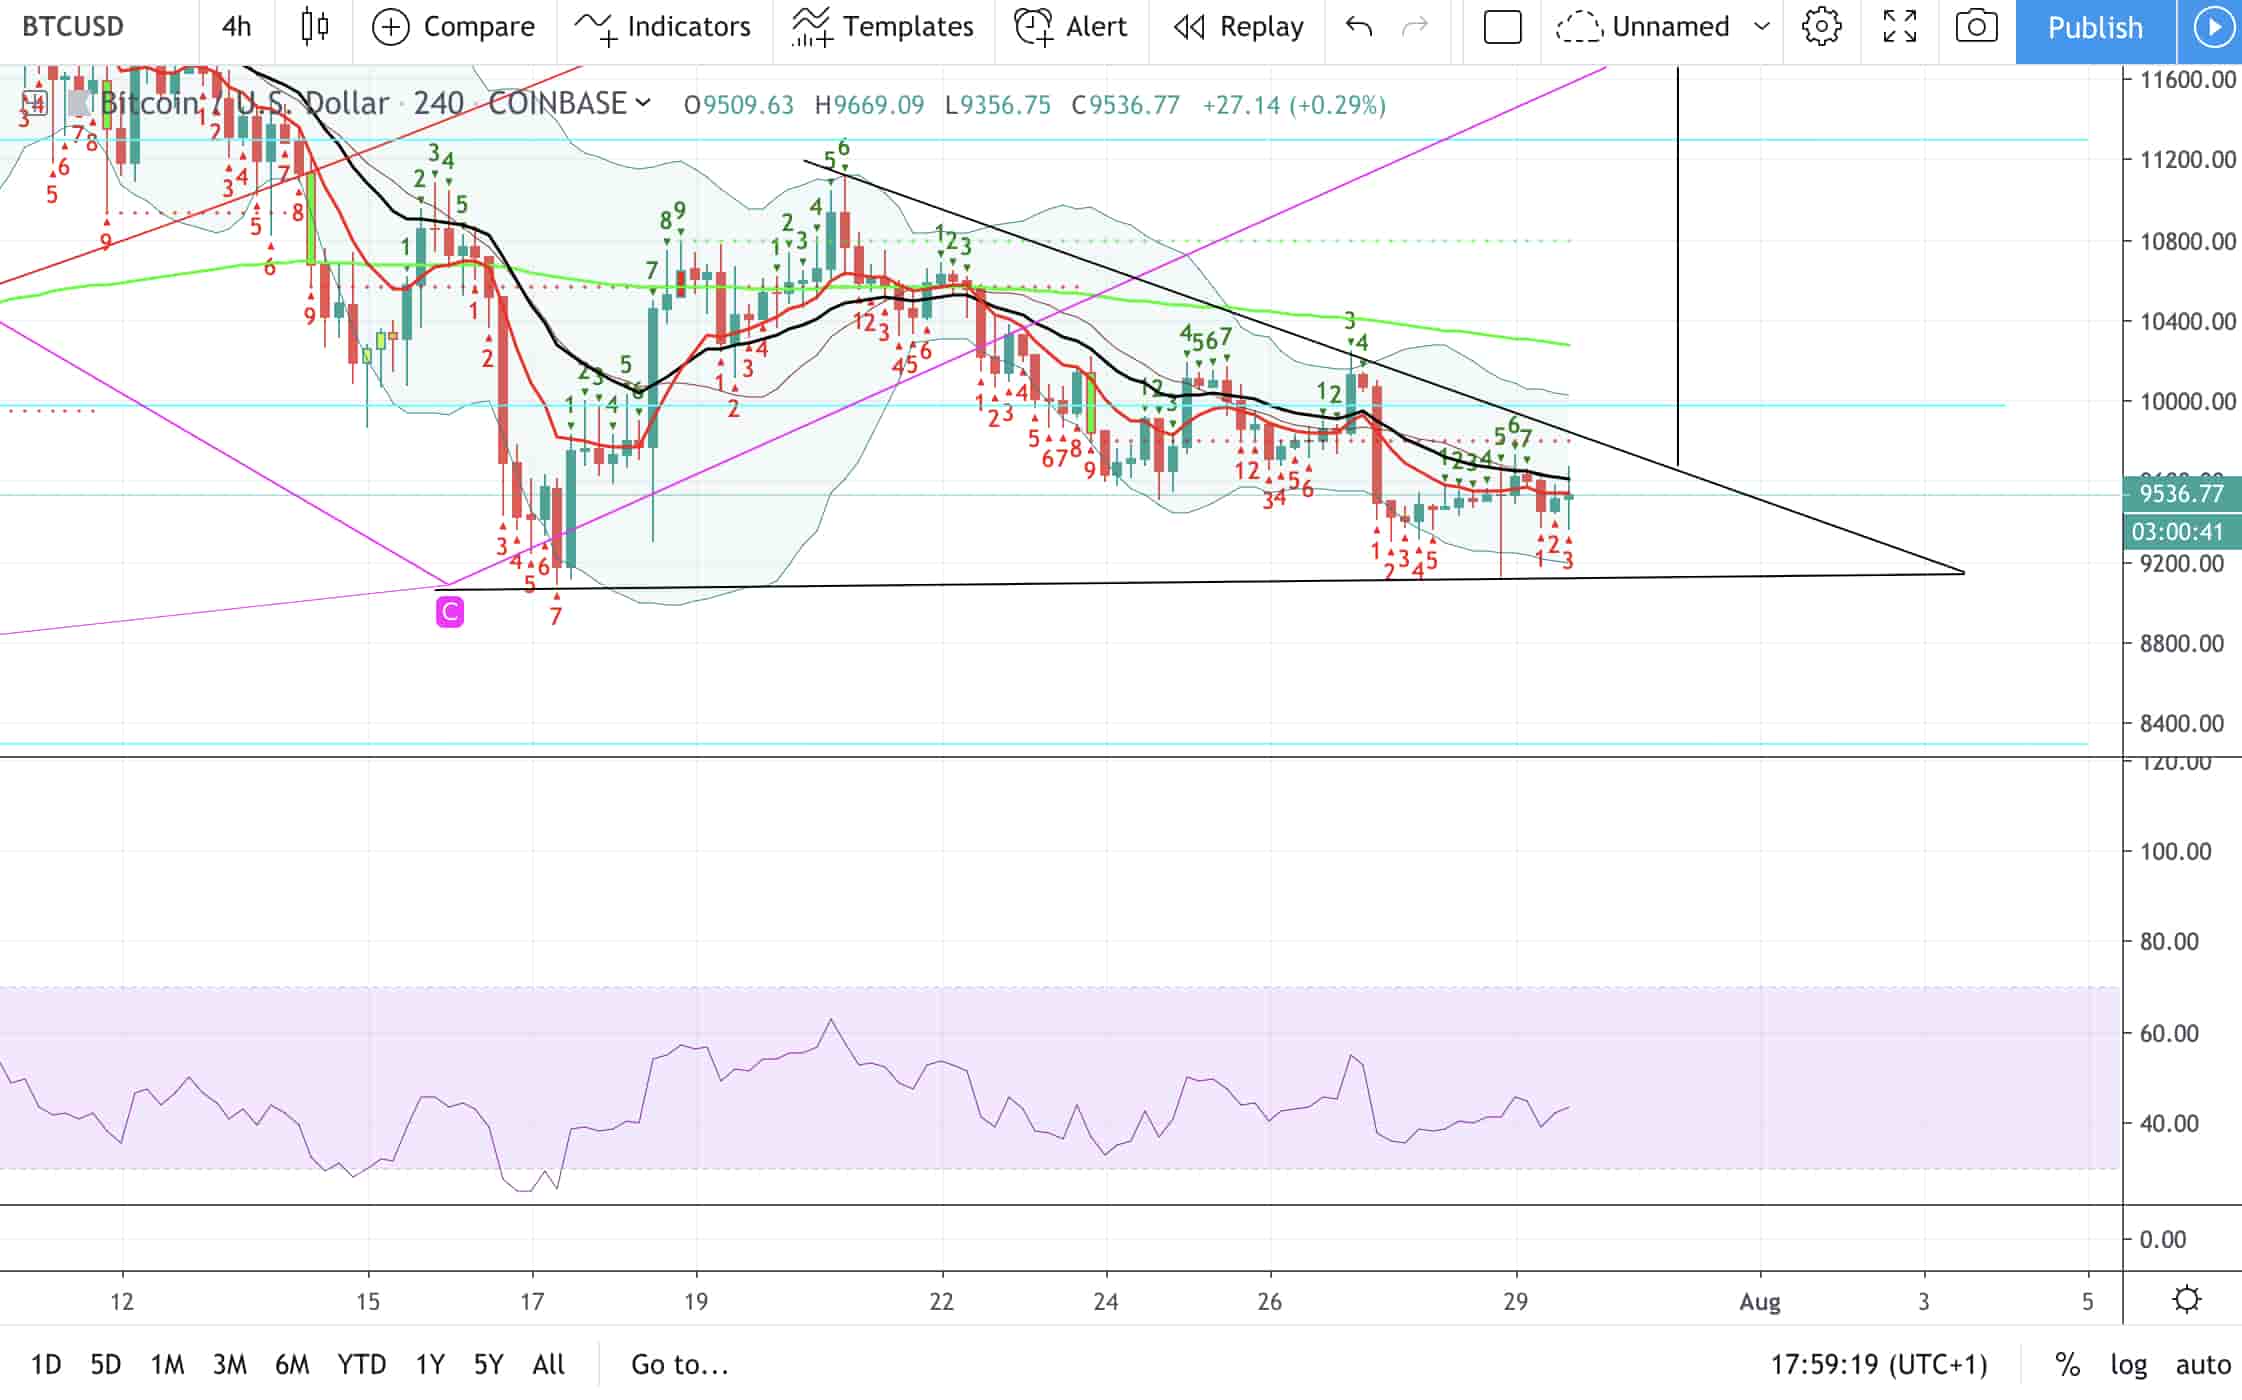
By looking at the 4-hour timestamp, we can see a bullish triangle and an ongoing (possible retest) TD count.
By looking at how everybody awaits for that $8,300 level, I am expecting that triangle to break bullish with the first target of $11,300-700.
If the triangle breaks bearish we will probably see $8,300, or even around $7,500 (I doubt we will go past 8,300 if that’s the case).
The situation is kind of risky at the moment, so beware traders. I’d expect a move to take place in up to 24 hours.
You need help to understand all the technical analysis and trading terms? Click here.
Please Note: This is not financial advice, it’s just me expressing my own opinion over the market. Please do your own due diligence before investing in such volatile markets.


