


")


 Tokens Playing This P2E Game")

BTC has been in a non-corrective bullish rally ever since its drop on March 12, 2020. The intermittent pull backs that we saw were negligible on a higher time frame.
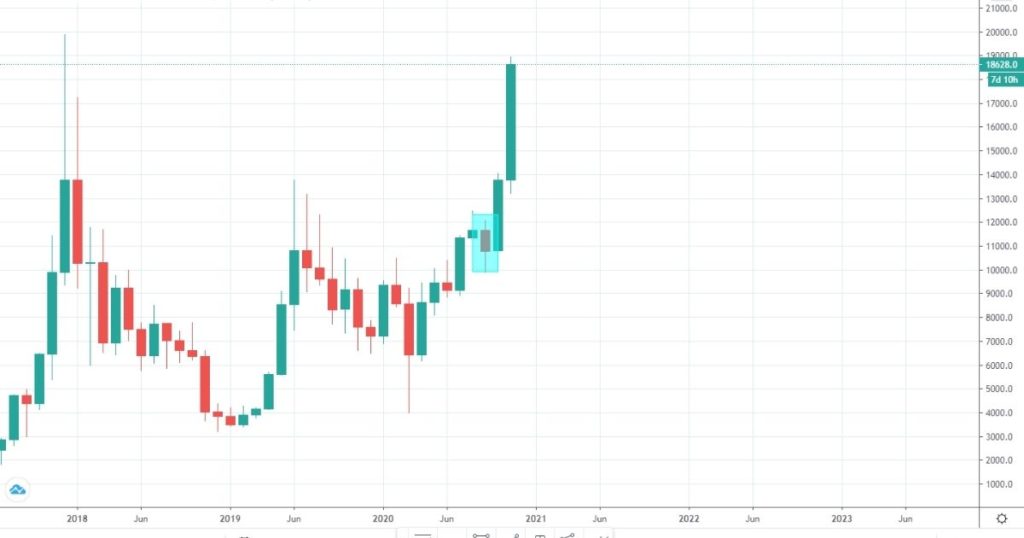
As we can see in the monthly Bitcoin chart, since March, out of eight months until November, only one month has been majorly corrective, which was September. June’s correction was insignificant.
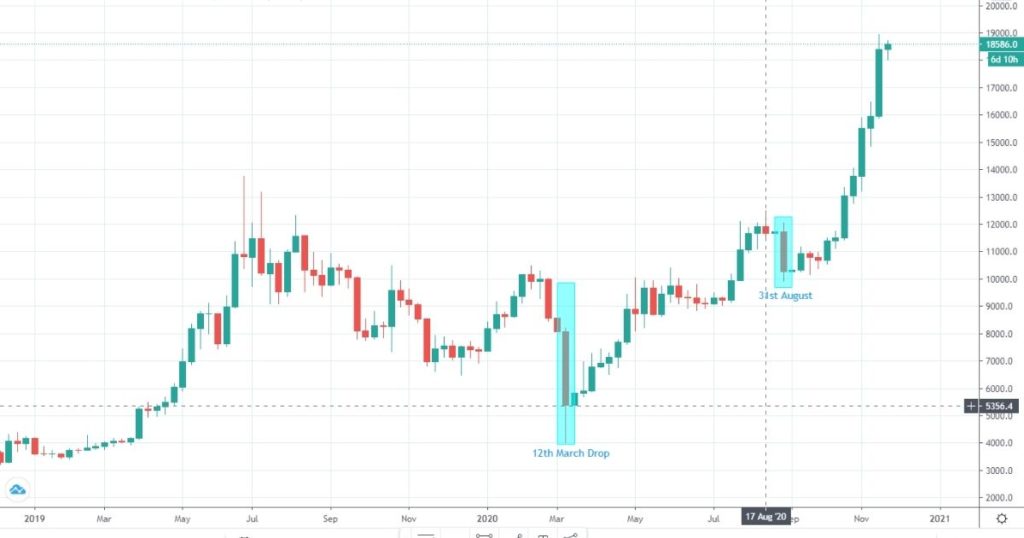
As we can see from the weekly chart above, after March 12, a major drop was in the week following August 31 where we saw a 20% pull back. Apart from that, there have not been any significant pull backs.
Such a rally is generally followed by a correction. BTC is nearing its all-time-high price of $20,000, which could be one of the major resistance levels and probably a temporary stop to this impressive rally.
All those who fell to FOMO in 2017 in BTC and bought at the current level can relate with what may follow next. So, is this the right time to get into BTC longs? Technically, the answer is NO. Let’s find out which would be good entry points for BTC longs.
Let us review the daily chart.
Support/Resistance Zone:
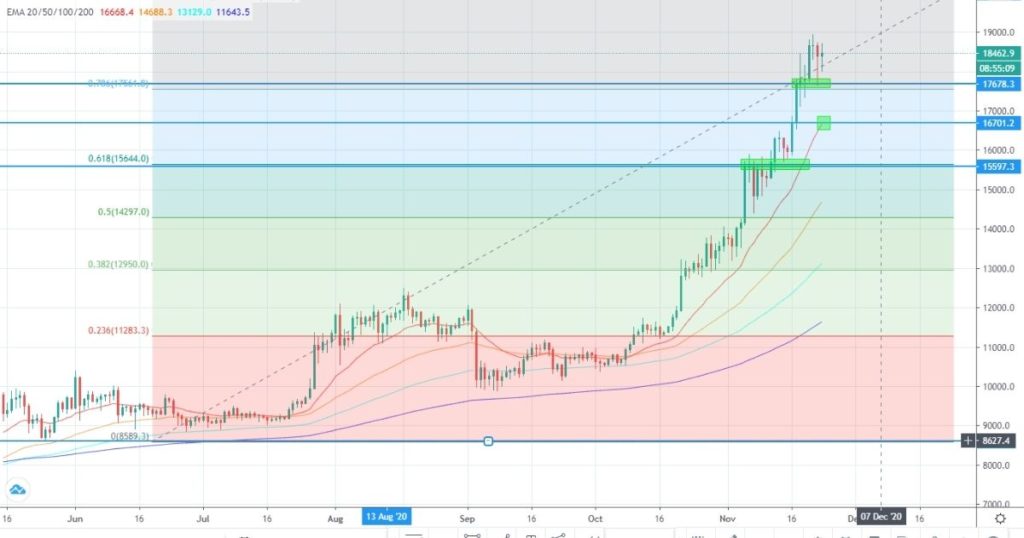
There are three zones that would be interesting to place long orders.
The first buy zone would be at the $17,600 area support zone. Second place to add longs would be at the 20 day EMA at $16,700, and if we can see a further downward movement, we can start adding our final longs at the $15,600 area.
Fibonacci:
Coincidently, if we plot the fibs from the all-time high to the recent accumulation zone lows of May to August, the 0.786 fib and 0.618 fib coincides with the support zones of $17,600 and $15,600, which would be a better risk to reward long areas.
What if we do not retrace back and break the all-time high price?
Yes, it is definitely a possible scenario, but the risk to long here is much higher compared to the rewards. In the scenario where Bitcoin breaks the price of $20,000, a more cautious approach would be to place longs once BTC breaks above $20,000, makes a move higher, and then retests $20,000 to flip it from resistance to support.
To conclude, it is a much higher risk to long here than to long after BTC:
- Breaks downwards towards previous support.
- Breaks upwards towards $20,000+ (unknown high) and falls back towards $20,000.
Images courtesy of TradingView.
Disclaimer
The information discussed by Altcoin Buzz is not financial advice. This is for educational and informational purposes only. Any information or strategies are thoughts and opinions relevant to accepted levels of risk tolerance of the writer/reviewers and their risk tolerance may be different than yours. We are not responsible for any losses that you may incur as a result of any investments directly or indirectly related to the information provided.
Do your own due diligence and rating before making any investments and consult your financial advisor. The researched information presented we believe to be correct and accurate however there is no guarantee or warranty as to the accuracy, timeliness, completeness. Bitcoin and other cryptocurrencies are high-risk investments so please do your due diligence. Copyright Altcoin Buzz Pte Ltd. All rights reserved.


