


")


 Tokens Playing This P2E Game")
_opt")
ETHUSD Short-Term Chart Analysis
- Support: 130$
- Resistance: 140$, 160$
- Current Price on CoinGecko: 130$
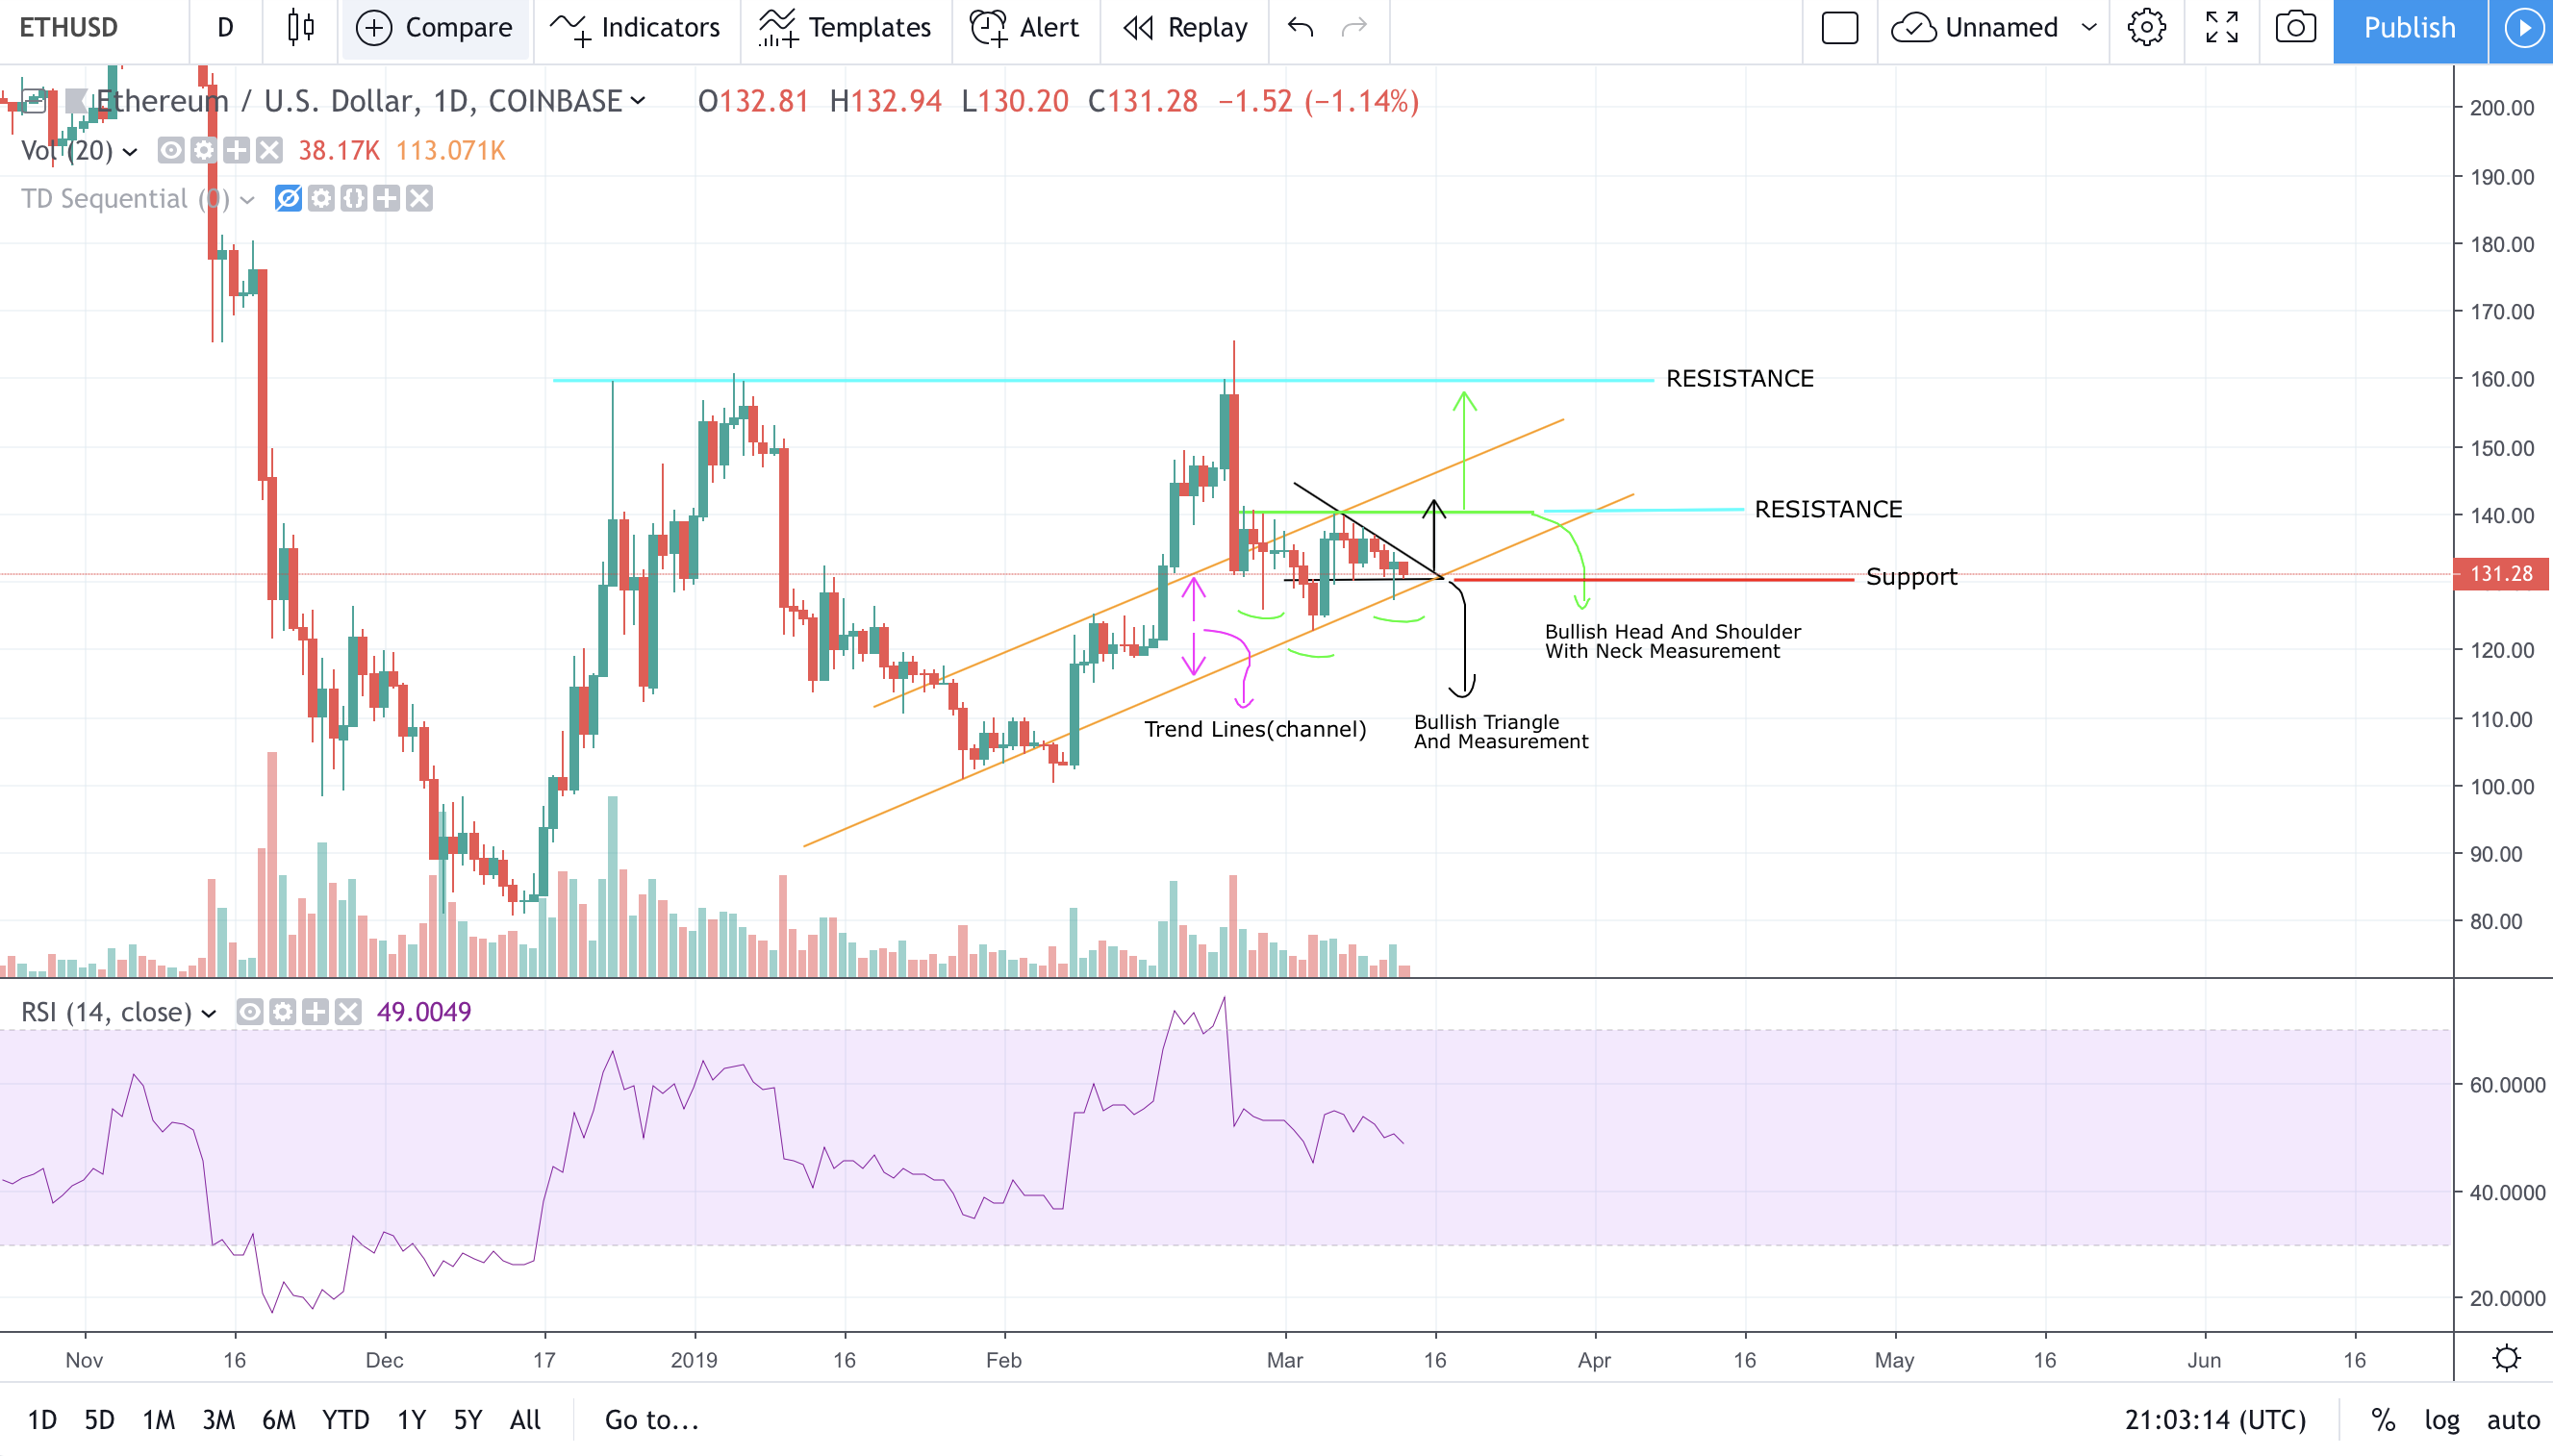
Looking on the daily chart it seems that ETH is in an uptrend, bouncing between the trend lines and currently it’s consolidating on the 130$ Support line, forming a Bullish Triangle which I expect to break upwards. If we break above the 140$ Resistance level, I am expecting to have a validation of the Bullish Head and Shoulders pattern, pushing the price towards the 160$ Resistance level.
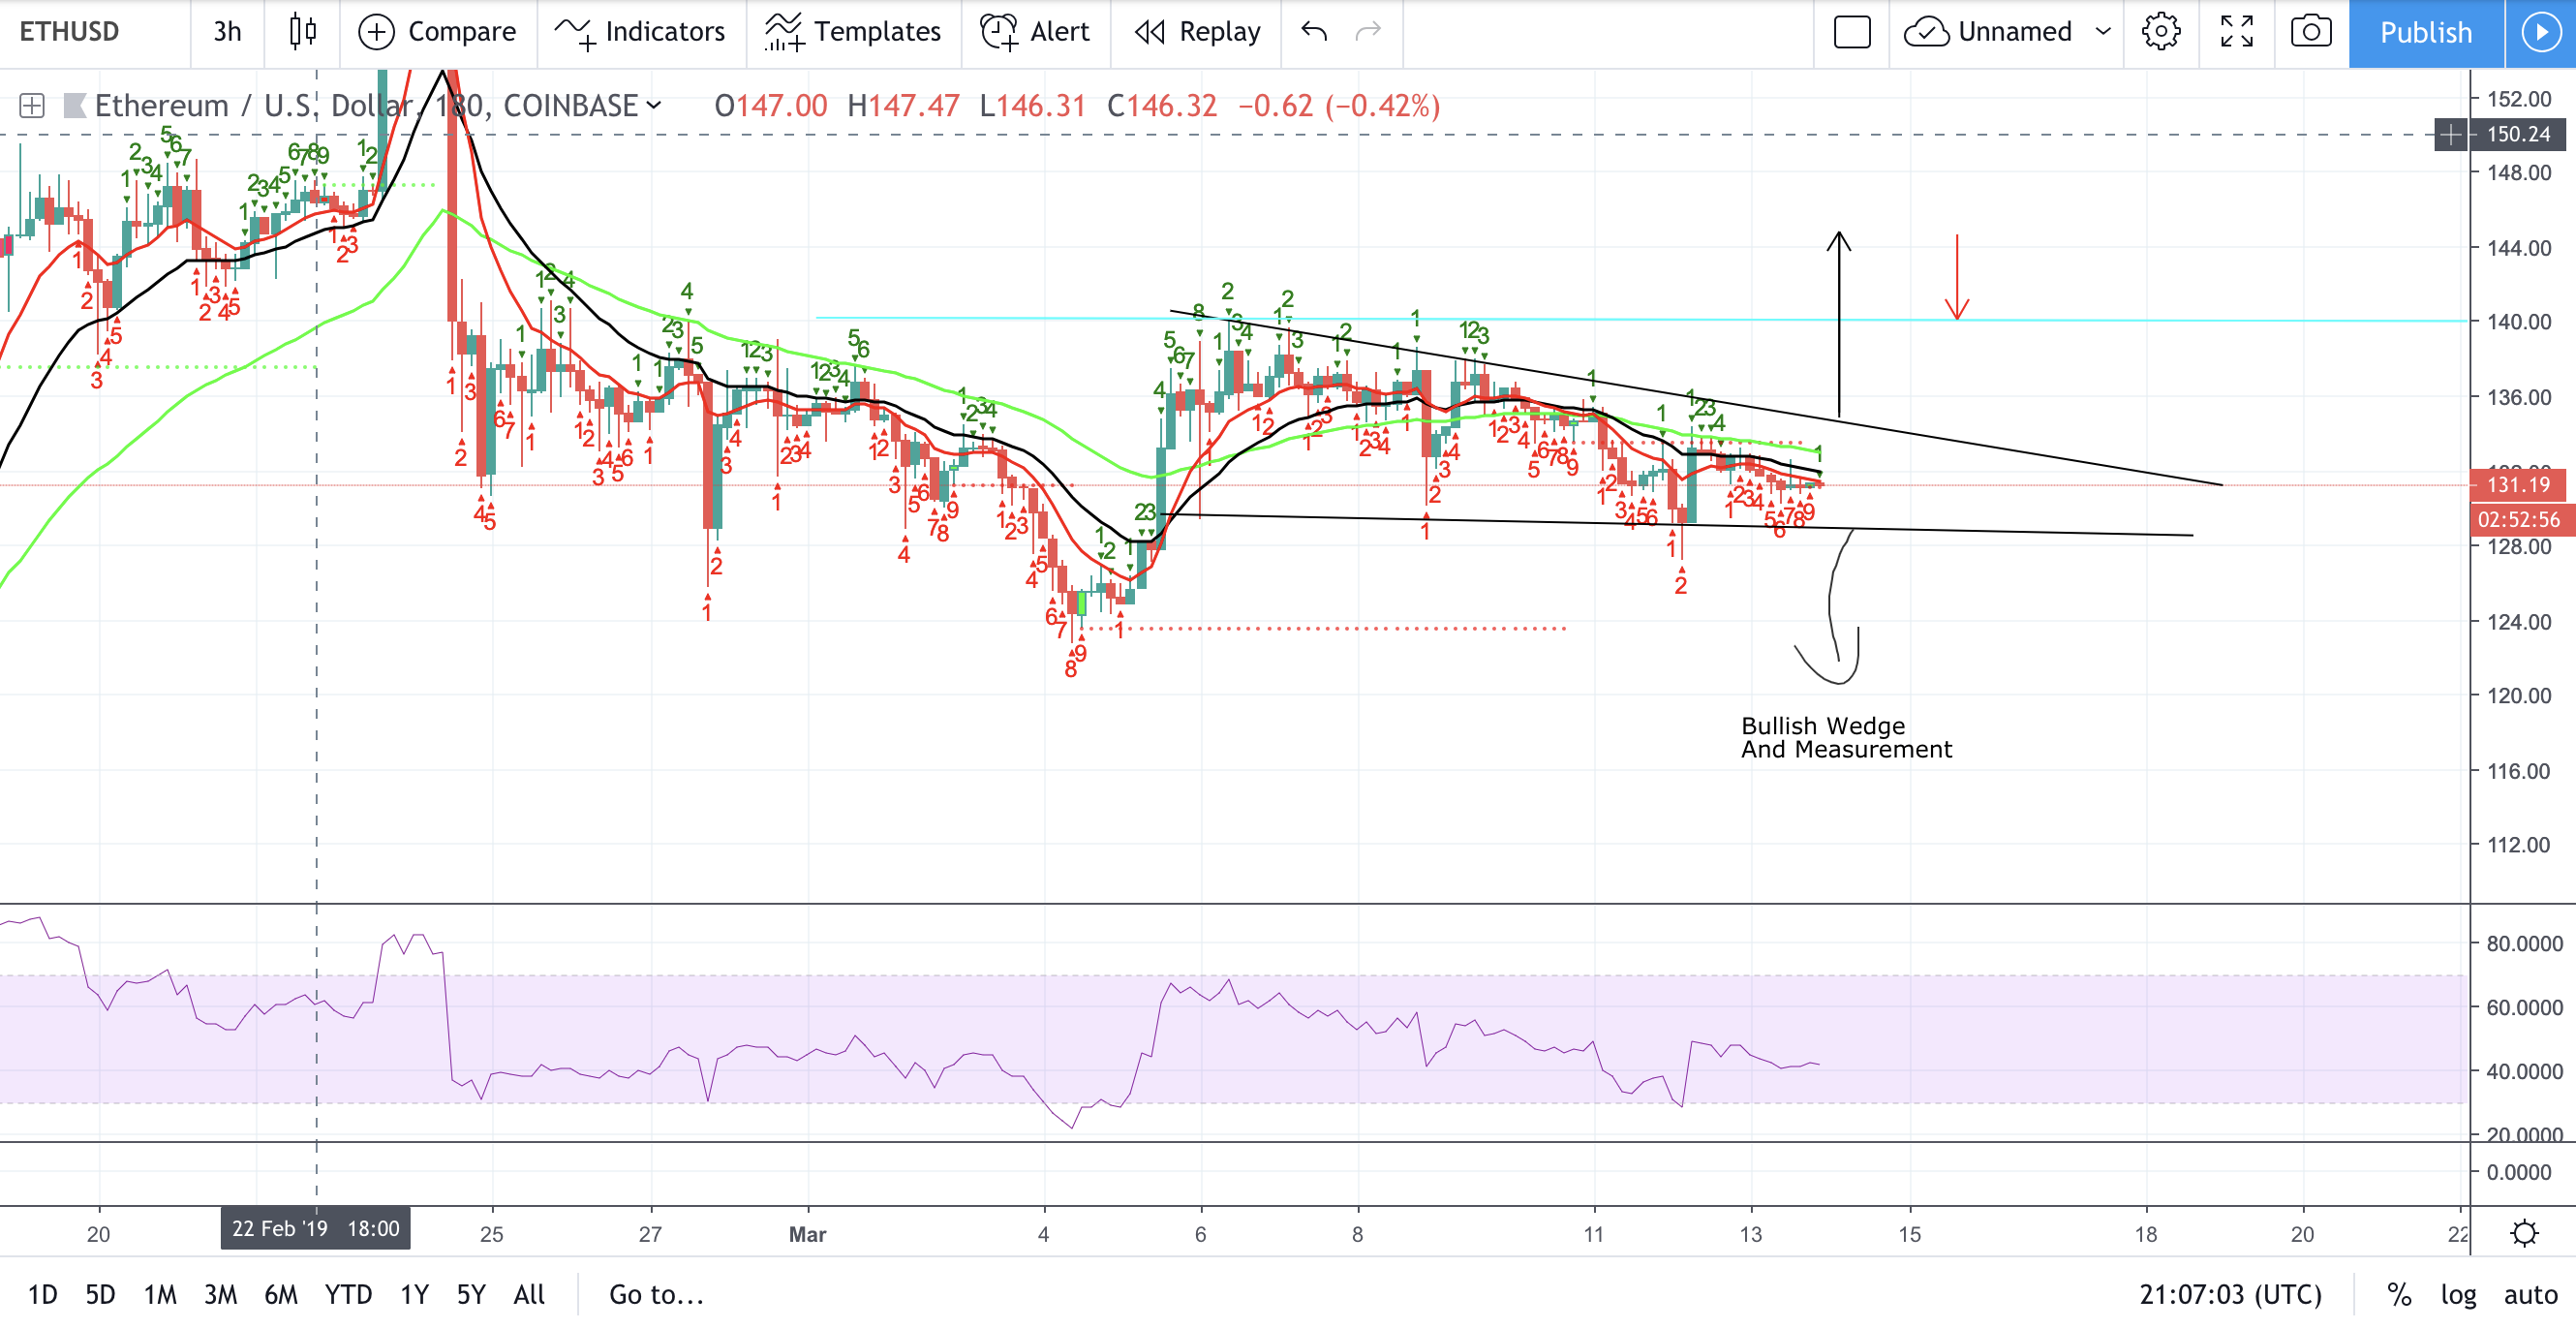
Moving on to a lower timeframe, on the 3h chart I find ETH still bullish. It formed a bullish wedge which I am expecting to break upwards trough the $140 resistance level and touch around $144. From there I would expect to fall back on $140 level, which now becomes support, and consolidate for a while. TD indicator is also on the 8th count, which indicates a bull move coming on the 9th count or later. I am expecting the spike that breaks the wedge to come very soon.
Overall, I think we are in the right direction and the market will continue to make new highs during the upcoming months. I can say that I am bullish.
Please, keep in mind that this is not financial advice, it is just me sharing my opinion. I am not a financial advisor. Always make sure to do your own due diligence before investing.

 | Knit Finance – Facilitating Cross-chain DeFi Interoperability")
