


")


 Tokens Playing This P2E Game")

TradingView has shared a chart on Twitter which indicates that Ethereum is in a consolidation stage, and a sharp rise is about to come in the short-term.
We will have a look at the chart and also look for other possible bullish indicators.
Chart shared by TradingView on Twitter:
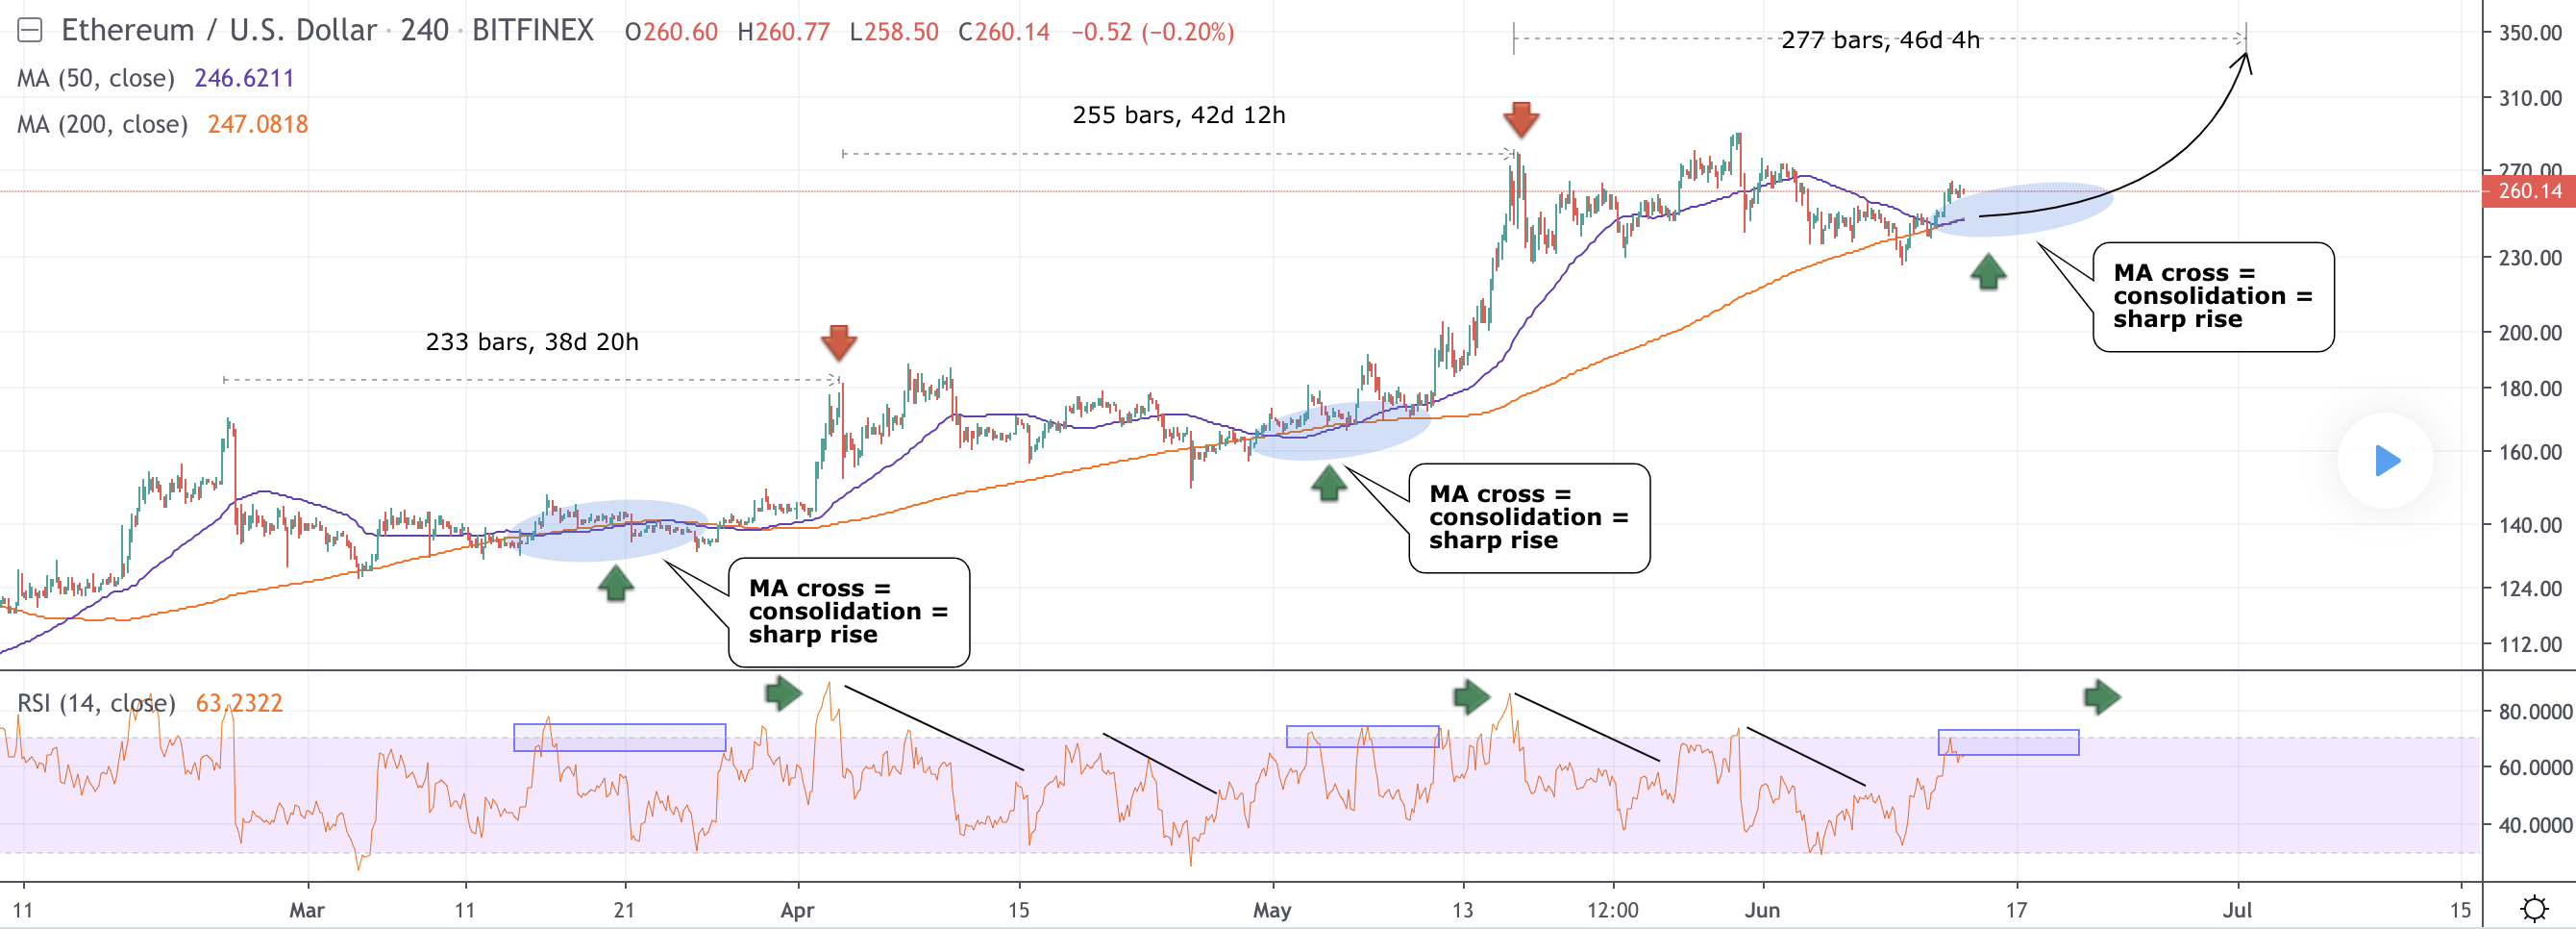
The above chart represents the 4-hour timeline and it indicates an upcoming consolidation of the 50 EMA in the range of the 200 EMA. If we look at the previous EMA consolidations, we can see a decent price surge after each consolidation. I don’t think the chart above is enough, so we are going to look at some more signs.
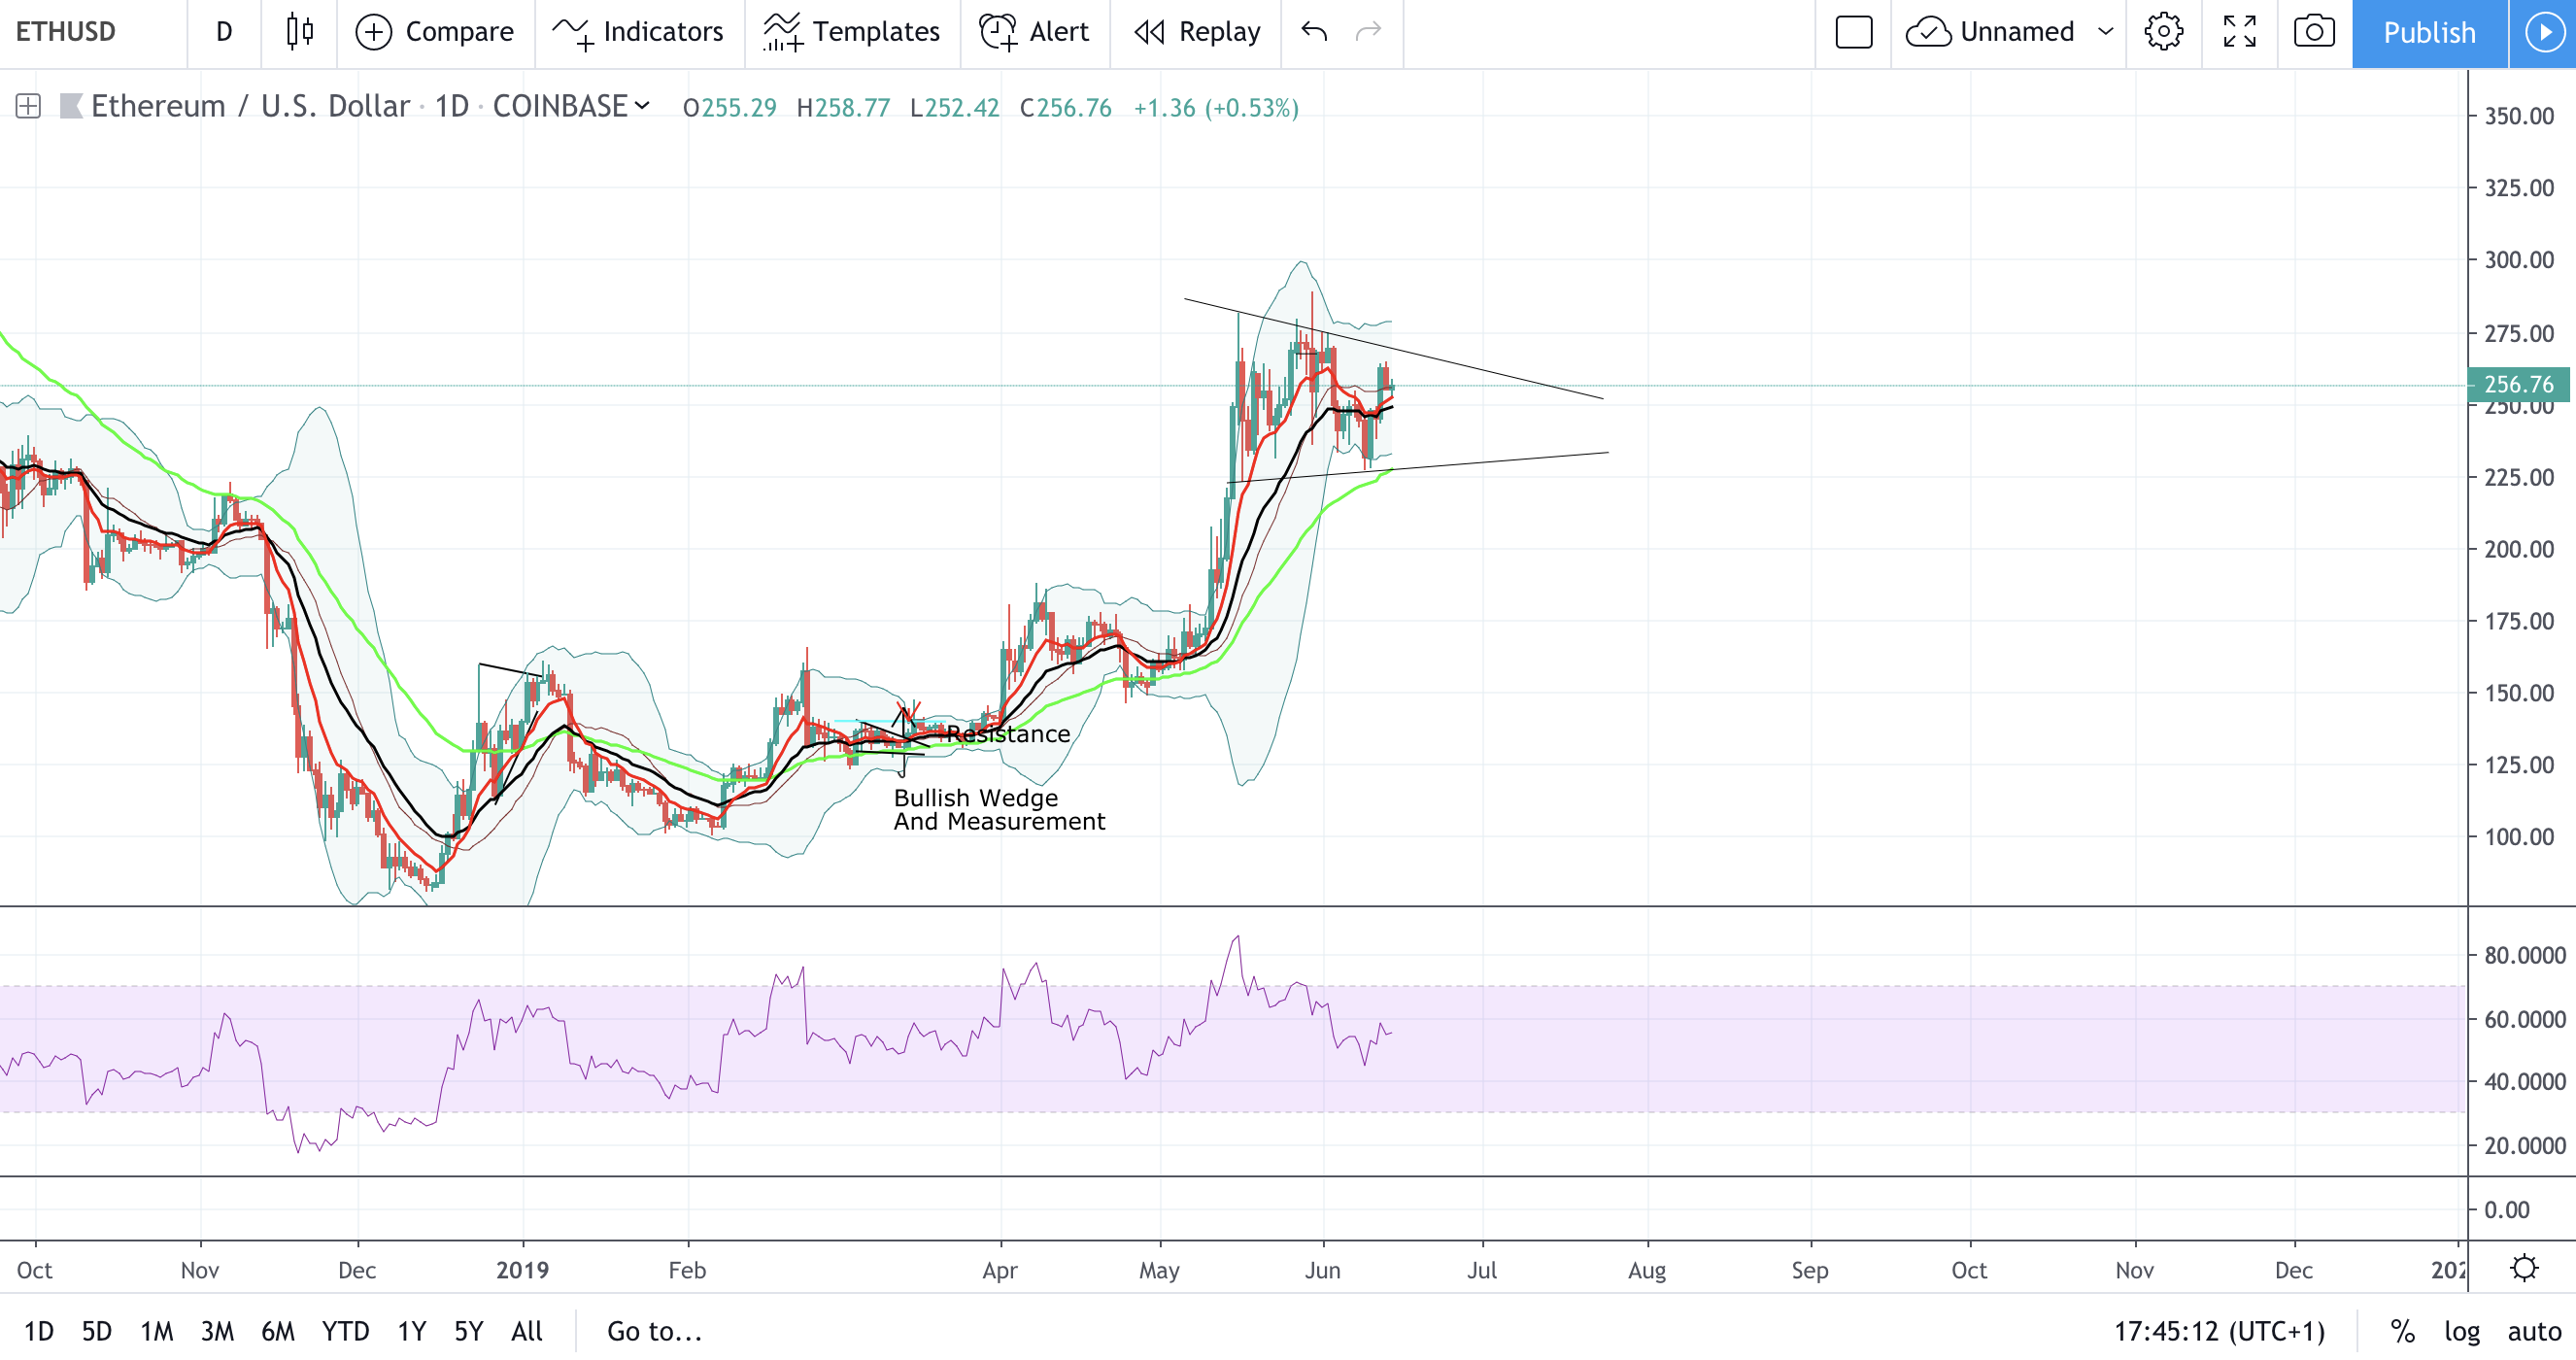
If we have a look at this daily chart, we can see a bull flag formation, a bearish EMA cross rejection, and the RSI trying to get back in the oversold area.
Given the signs above, there is no doubt that we should expect a decent price surge pretty soon, however, we should stay cautious since we haven’t seen a good correction in a while.
In conclusion, it looks like ETH is in the accumulation phase, however, we should have stop-loss orders in, just to be safe.
If the bullish scenario plays out, we could be looking at a $360-400 Ethereum.
As TradingView said:
“bulls should be happy with this”
NOTE: This is not financial advice, the reader must do his own due diligence before investing in any type of asset.


