


")


 Tokens Playing This P2E Game")

Moving averages are popular for trading because they are simple and they work. And they are flexible too as you can select time periods of minutes up to years. Every good charting software program lets you pick the time frame you want to cover.
We’ve drawn a 200-day SMA over the candlestick graph of BTC/USD in the chart below. A moving average is known as a ‘Simple Moving Average’ (SMA), and it is known as a 200 Day SMA since it is calculated using the most recent 200 days of data. It is the average of 200 days (or any number of days between 1 and 200) to make a smooth curving line known as the moving average line, which moves as time passes.
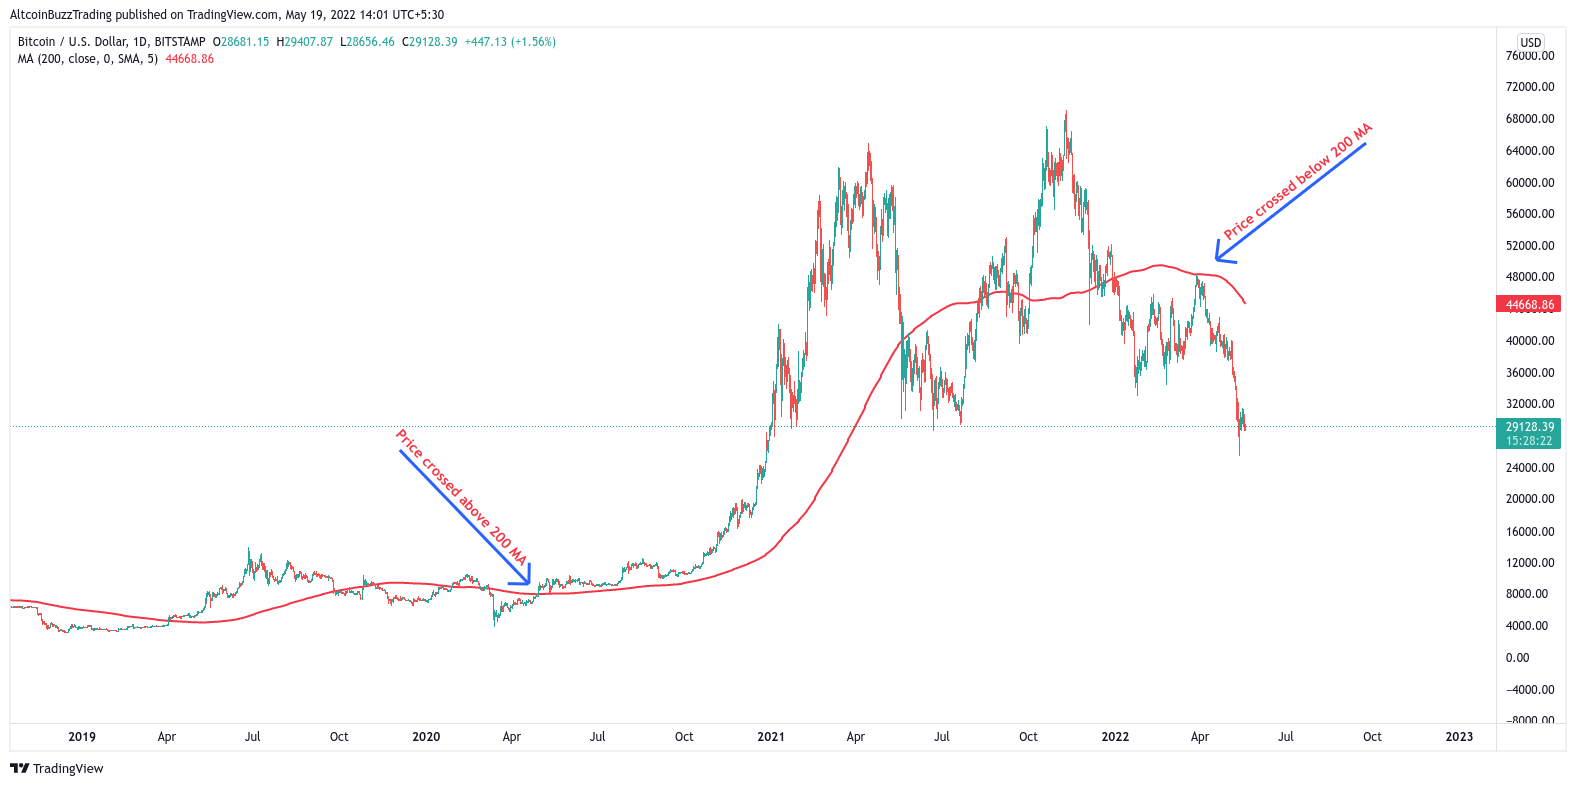
Traders use moving averages as a way to measure sentiment. If the price is above the average, that’s bullish and if not it’s bearish. Moving averages help show us when there are more buyers at the current price than at the average price. Again, that’s bullish. These averages are often excellent entry and exit points for a new trade.
Similarly, when the asset price trades below its average price, it indicates that traders are eager to sell the shares at a lower price. This indicates that traders are bearish on the crypto market. As a result, one should consider selling options. Based on these findings, we can create a simple trading system. A trading system is a set of rules that aid in the identification of entry and exit locations.
Long Term Trend Strategy
We’ll now attempt to define a 200-day MA based trading method. Remember that a smart trading system will provide you with signals to enter and exit trades. The following rules can be used to define the moving average trading system:
Rule 1: Buy (go long) when the current market price exceeds the 200-day MA. Once you’ve decided to go long, you should stick with it until the necessary sell condition is met.
Rule 2: When the current market price falls below the 200-day MA, exit the long position (square off).
The profitable trade assures that you stay in the trend for as long as it lasts. It can take months in some cases. As a result, MA can be utilized to uncover long-term investment opportunities. The key to using the MA trading system is to take all of the trades and not pass judgment on the signals that the system generates.
Crossover Strategy
In a sideways market, the problem with the basic moving average approach is that it provides far too many trade signals. A moving average crossover system is an enhancement to the standard moving average system. In a sideways market, it allows the trader to make fewer trades. In an MA crossover system, the trader uses two moving averages instead of a single moving average.
Combining a 100-day MA with a 200-day MA is a good illustration of this. The faster-moving average is also known as the shorter moving average (in this case, 100 days). Slower moving average refers to the longer moving average (200 days moving average).
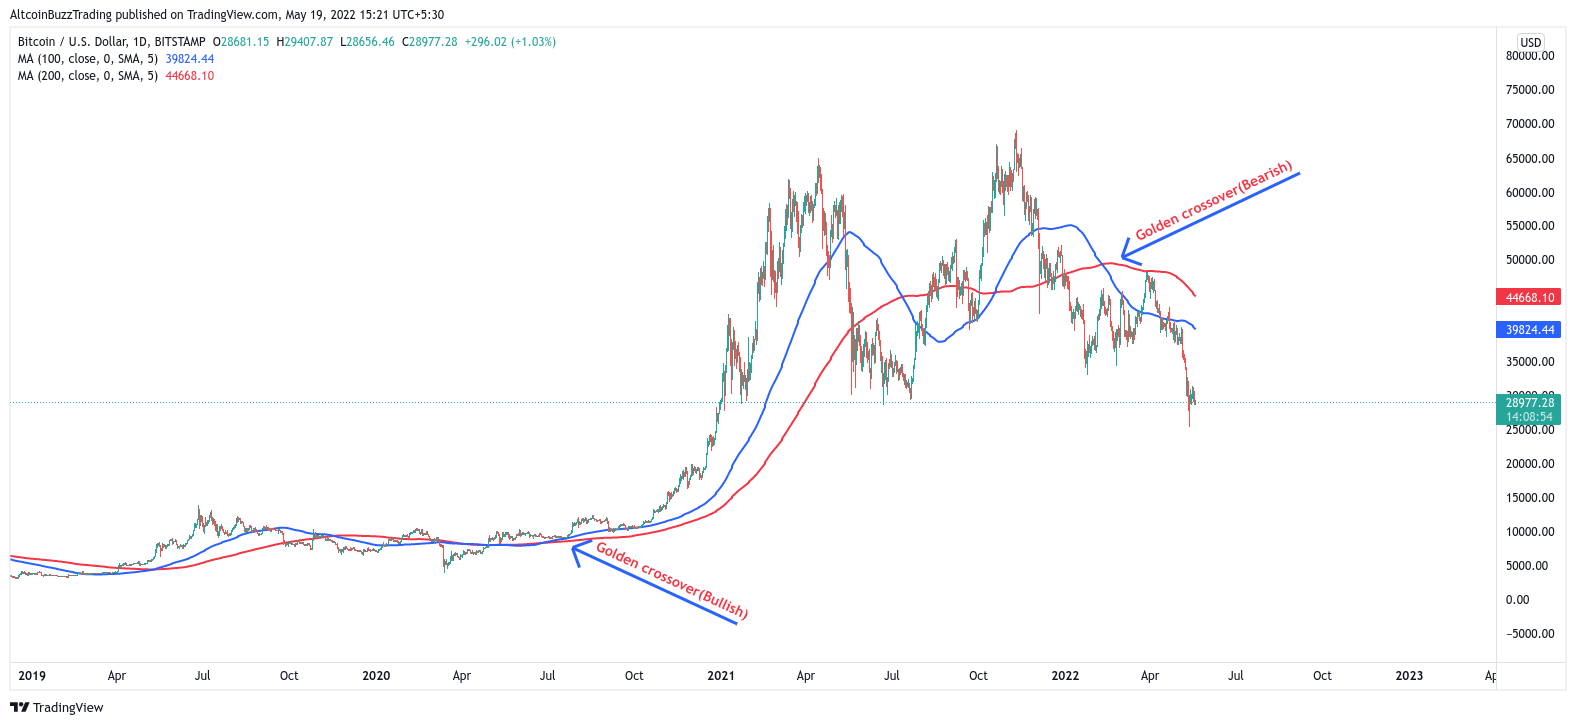
Because the shorter moving average uses fewer data points to create the average, it tends to stay closer to the current market price and hence reacts faster. In the chart above, the purple 100 day MA line is closer to the present market price (because to its faster reaction time) than the red 200 day MA line (as it reacts slower).
Traders have combined the crossover strategy with the standard MA system to smooth out entry and exit positions. The crossover system’s entry and exit rules are as follows:
Rule 1: When the short term moving averages exceed the long term moving average, buy (new long).
Rule 2: When the short-term moving average becomes less than the longer-term moving average, exit the long position (square off).
Some market experts and traders are wary of the crossover approach and are hesitant to use it. They say that the crossover is ineffective as a trading indication since the crossover pattern is typically a lagging indicator. While their reasoning contains some merit, the crossing is a critical indicator in the financial markets.
The crossing is significant since it is an effective technical indicator for both analysts and traders. This means that the chart pattern has a better probability of attracting a lot of buying and selling in a given market.
Conclusion
Traders are always looking for ways to reduce risk. To increase the risk-reward ratio, identifying locations or points that offer low-risk bets must aligns with multi-timeframe analysis. It is necessary to be an all-rounder in order to be a successful and consistent trader. Position sizing and risk management must be combined with a risk-reward approach that is favorable. It’s worth noting that trading is a game in which the law of huge numbers shines brightly. There may be moments when the technique fails, but it will pay off in the long run.
And for our best, freshest research on NFT buys, Layer 1 chains, DeFi, or games, come check out Altcoin Buzz Access. Plans start at only $99 per month
For more information on cryptocurrency, visit the Altcoin Buzz YouTube channel.
Images courtesy of TradingView.
Disclaimer
The information discussed by Altcoin Buzz is not financial advice. This is for educational and informational purposes only. Any information or strategies are thoughts and opinions relevant to accepted levels of risk tolerance of the writer/reviewers and their risk tolerance may be different than yours. We are not responsible for any losses that you may incur as a result of any investments directly or indirectly related to the information provided.
Do your own due diligence and rating before making any investments and consult your financial advisor. The researched information presented we believe to be correct and accurate however there is no guarantee or warranty as to the accuracy, timeliness, completeness. Bitcoin and other cryptocurrencies are high-risk investments so please do your due diligence. Copyright Altcoin Buzz Pte Ltd. All rights reserved.
 Updates | July Week 3")

