


")


 Tokens Playing This P2E Game")


Usually, when we do these on-chain indicator articles, we look at Bitcoin. And that’s because Bitcoin is the biggest and the most important project. Also, is the longest-running project it has the most on-chain data.
But ETH has a good amount of data too. It’s also the undisputed 2nd largest project in crypto and has been for some time. So today, we are going on-chain to check out Ethereum’s fundamentals. Want to see what we found? Then let’s take a look.
Bitcoin and Ethereum Exchange Data
Bitcoin and Ethereum are different in lots of ways. But, one of the most important differences, when we look on-chain, is with exchange data. Take Binance for example. It started in 2017 and had its first full year of operation in 2018.
But Bitcoin started long before that. So what did HODLers from say 2013 or 2015 do? They moved their coins into non-custodial wallets and/or cold storage. This means exchange flow, how much Bitcoin is moving onto exchanges, tells us more than how much Bitcoin is there on the exchange as reserves. Because investors only move from non-custody or cold storage when they are ready to trade or sell.
However, Ethereum is much more recent. More ETH stays on exchanges since you need it to pay for gas for many non-ETH but ETH transactions. So exchange reserves of Ethereum will be higher and more consistent. For ETH, differences from the mean are important as there is always a set amount on exchanges for trading purposes and to pay for gas.
Indicator #1: ETH Exchange Reserves
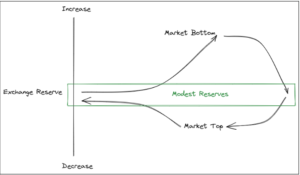
As we’ve just said, there is always some ETH on exchanges so we want to see changes in exchange reserves. If the mean is 100 ETH and reserves climb to 150, this is a sign we are at or close to a market bottom. Investors are quick to sell as more are sending their ETH to exchanges.
When exchange reserves decline below the mean, that could be a sign of a market top. And in these cases, we recommend:
- When exchange reserves are increasing: Since a bottom is in (recent or for the market as a whole) then you should look to buy ETH here.
- When exchange reserves are below the mean: We recommend our slow and steady dollar cost averaging (DCA) technique to add to your positions.
It may sound counter-intuitive that when exchange reserves are increasing, you should increase your positions too. But remember, it’s close to a bottom here and while we don’t time the market, the odds are in our favor.
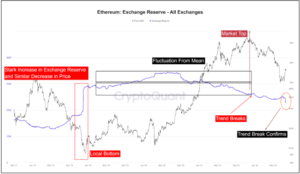
So what’s going on now? If you look over at the little red circle on the far right of this chart, we get a confirmation of declining exchange reserves that started a couple of months prior. That confirmation means the bear market is still here. And you should continue (or start a new one if you don’t have one) your DCA strategy.
Indicator #2: ETH Funding Rates
Funding rates are something traders use. For leveraged positions like futures, traders have to pay to maintain their positions. Then, positive funding rates are bullish meaning more traders are going long. A negative one then means more traders are going short in their new trades.
Funding rates can give us an idea about how stable the market is and which direction traders are watching closely. Therefore, in bear markets, as we have now, negative funding rates are common. Many traders jump on the downtrend and try to trade with it and the idea that ‘the trend is your friend’. But for ETH, this has NOT happened. Even as the price is declining, funding rates are still positive, which you can see on this CryptoQuant chart in the green.
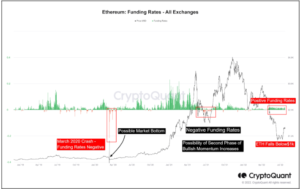
Note: The positive funding rate means investors are still bullish on ETH despite its price action.
Our takeaways from this bullish sentiment are that traders still like ETH because:
- They are bullish on The Merge and see it as coming to fruition soon and being positive for ETH AND
- Traders think The Merge can help ETH decouple from Bitcoin
More about ETH Funding Rates
Moreover, decoupling has been a topic for a long, long time and we aren’t going to rehash it here. But many believe that since Bitcoin’s objectives are so different from ETH. And that it’s vital for ETH’s growth to be able to decouple its price performance from Bitcoin’s. That’s despite both being good long-term investments so far.
And with EVMs, smart contracts, and dApp building, ETH does have more in common with other Layer 1’s like Avalanche, BNB Chain, and Solana, than it does with Bitcoin. For example, most of Bitcoin’s development is not for sidechains or apps although Rootstock, Liquid, and Stacks exist. Most of Bitcoin’s development is for the maintenance and improvement of Bitcoin’s source code.
In addition, ETH, BNB, and AVAX have lots of developer activity. But that’s because they have devs who are trying to build the next OpenSea, Uniswap, PancakeSwap, or Trader Joe. It’s a large fundamental difference that we will be watching in the future.
To conclude on funding rates, traders are bullish on ETH. That’s despite both price and market conditions. And we can see that thanks to the positive funding rates.
ETH Miner’s Revenue
Miners are an important part of any PoW chain. And even with The Merge coming, mining is still going on to secure new blocks. And mining revenue is way down on Ethereum. It declined 45% from May to June. A huge difference from just a month ago.
Miners often sell their block rewards. But there’s a difference between wanting to sell and having to sell. When ETH is in a big bull market, miners sell for extra profit. However, when prices are cratering like now, often miners are forced to sell just to maintain their operations and payments on all their hardware. And right now, it looks like more miners are in a position of having to sell.
Does that mean there’s increased selling pressure on ETH? Yes. But, does that also show us a sign that maybe the market is oversold? Also, yes.
Conclusion
So where does that leave us? Exchange results look bearish. The downtrend below means that ETH exchange reserves are confirmed. Therefore, ETH funding rates look bullish. This means that traders are entering new long positions despite terrible downward price action.
Also, miner Position activity is neutral, at best, based on declining revenue and ETH prices. So keeping score at home, that’s 1 for bullish, 1 for bearish and 1 for neutral to bearish. It doesn’t seem so confusing that ETH, and many other projects, are lacking in direction and trend now. No trend other than keeping the bear going for a while based on indicators like these.
This is why we like DCA (Dollar Cost Average) as a strategy. You don’t have to try to time anything. But if you believe things will improve for ETH, then it’s sensible to buy and hold here. And no matter how sure or not you are, you can buy more ETH when prices are down and see that value grow when prices rise again.
Unlike some of our on-chain videos, the only clarity we have here is lack of direction. But the indicators are still valuable for what signs they can show us. And if the market doesn’t know what it’s doing yet, then it’s good for us to know that.
For more cryptocurrency news, check out the Altcoin Buzz YouTube channel.
Find the most undervalued gems, up-to-date research and NFT buys with Altcoin Buzz Access. Join us for $99 per month now.


