


")


 Tokens Playing This P2E Game")


2021 was a phenomenal year for crypto, especially with two peaks in May and November at $64k and $69k, the story of the first half of 2022 is a bit different. However, Bitcoin has dropped to mid-17k levels, with an average loss of 75%, from its All-Time High.
Although it has recovered from the sub-20k region, it is unclear where and when bitcoin will mark the bear market bottom. Rest assured, buying $BTC below $20k is an excellent decision, but the question fumes, is 17k the bottom already? Also, two major on-chain indicators flashed last week. Therefore, in this article, we will be focusing on those two indicators and their likely implications.
1) Net Unrealized Profit
Net Unrealized Profit (NUP) is one of the crucial real-time on-chain indicators that track the relative valuation of any asset. In this case, Bitcoin has a NUP ratio of 0.38, which means roughly 38% of the bitcoin supply is in profit. Here is a chart about it:
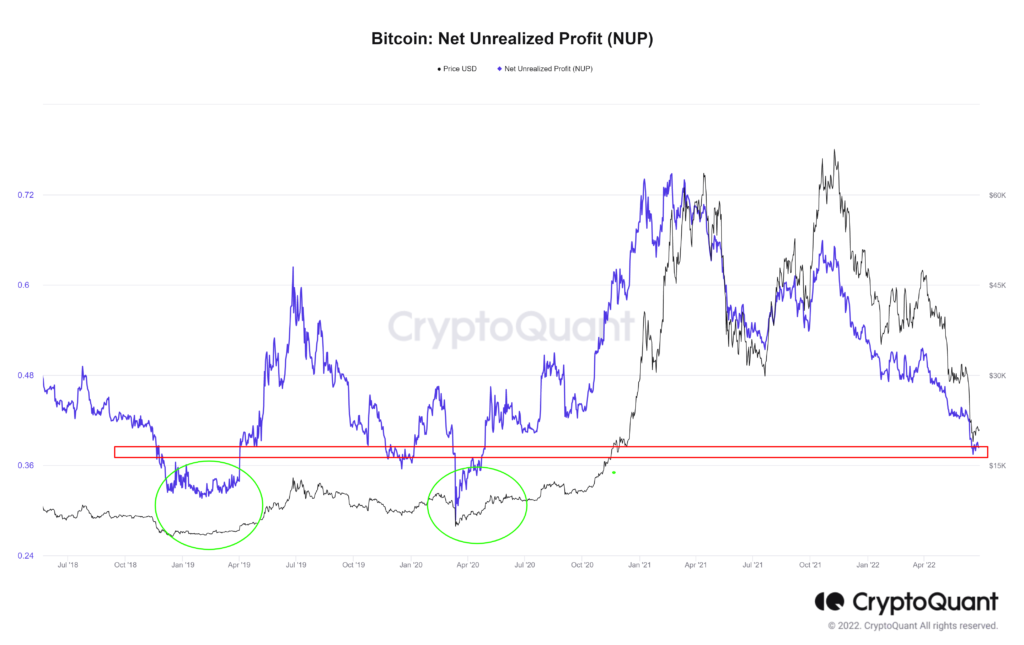
Mathematically, Net Unrealized Profit is the relative change of market cap and realized market cap. In other words, it is an account of the supply held by profitable hands.
But What Can the Nup Number Tell Us About the Market?
Historically, a NUP value over 0.7 signals a bull market top, and values below 0 imply a bear market bottom. Is that a fixed rule? No. Because of three reasons:
- Bitcoin as an asset does not have a long history
- Whales can manipulate bitcoin price action anytime
- The presence of institutional interest is a new phenomenon
Ideally, a decreasing NUP value shows the number of investors in profit is shrinking. Investors in loss dominate investors in profit, and a basic investment logic is nobody likes to sell for a loss. Therefore, when sell-side pressure decline, bitcoin usually trades in a range that will be ideal buy zones.
So, the million-dollar question is, is bitcoin in such a range? The short answer is – ‘probably’!
What Is the Current Situation With NUP?
The Net unrealized Profit value hovers around 0.38 at the time of writing this article. That means the amount of bitcoin in profit in June 2022 matches that of December 2018 and November 2019. However, the bitcoin price was less than $10k at that time. Does it mean we are in a position to buy the relative 2018-19 levels? Yes!
For any market, price is a lagging indicator. Therefore, for a manufacturing firm, the advanced technology and widening user base front-run the value of the stock. For a DeFi protocol, TVL is the leading indicator.
We can say that the decreasing trend of NUP and sideways trading of $BTC can be the leading indicators of the next bull market.
But who are in loss and who are in profit? Of course, the long-term holders will be in profit, but it is tricky to answer whether these long-term holders are whales or miners. Another on-chain indicator, the Exchange Whale ratio can shed some light on it.
2) Exchange Whale Ratio
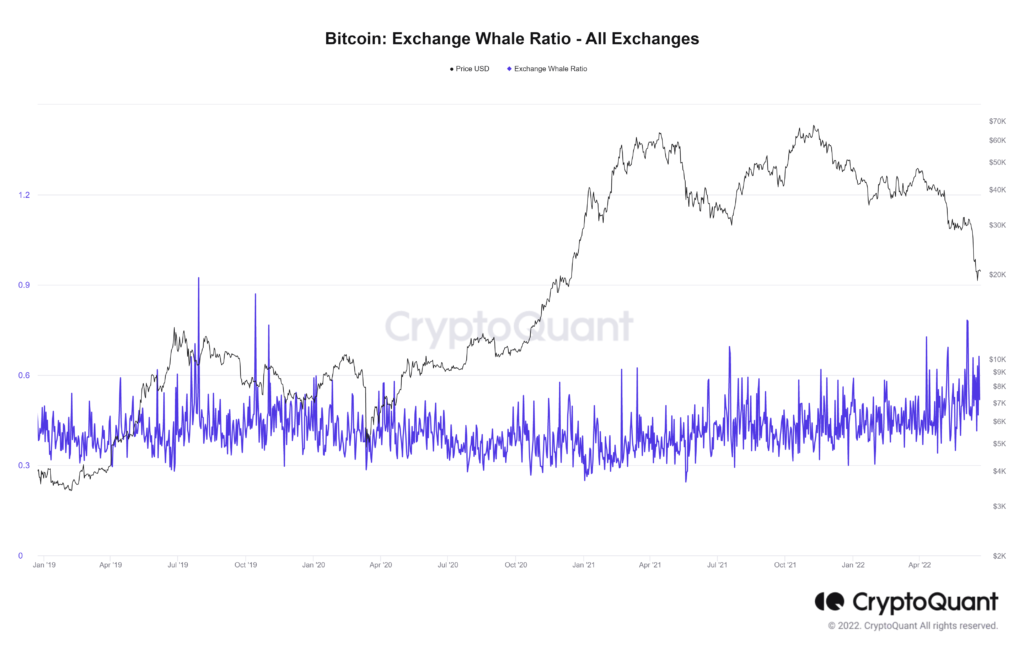
The Exchange Whale Ratio indicator is the ratio of BTC in the top ten transactions to total BTC inflows into the exchange. In other words, it measures the whale activity on centralized exchanges. Although it is primarily used to identify top exchange with sufficient liquidity and arbitrage opportunity, it can also indicate whale activity.
In the recent weeks, drops to 28k and then to $24k are all miner-induced movements. We know that the difficulty of bitcoin mining increases with time. That means miners receive lesser bitcoins than in the previous cycle. But when the price of bitcoin decline, miners are forced to sell their bitcoin holdings to sustain the mining. Then the long-term holders who are in profit can not be miners but whales.
How To Estimate The Presence of Whales?
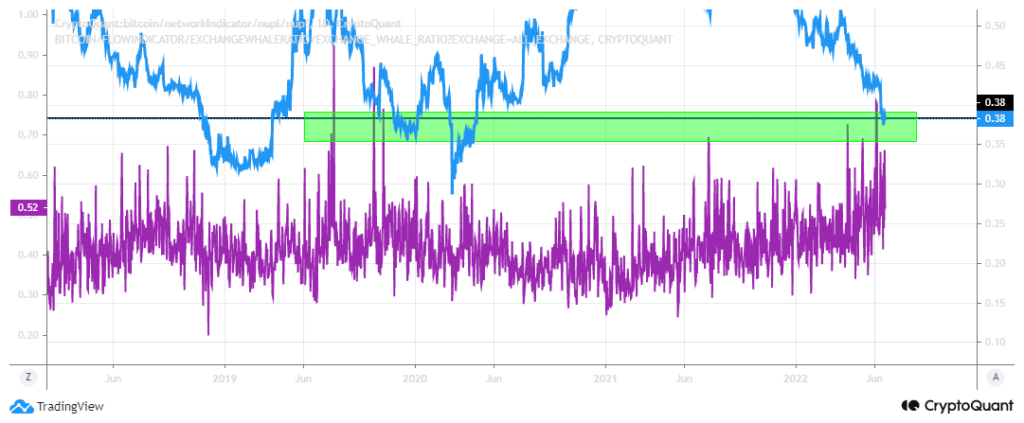
The exchange whale ratio is a great indicator that can analyze the whale activity in centralized exchanges. From the chart, we can see that whaling activity has been increasing since June 2021. Recently, in June 2022, the whale ratio has crossed 0.7 for the first time since 2020. In this chart, you can see more about this indicator:
So it’s clear that the long-term holders and the hands in profit are whales. Therefore, when whale activity rises in an uptrend, it likely indicates a local top. Because whales usually send their bitcoin to exchanges to sell. Similarly, in a downtrend when whale activity shoots up, it is whales buying bitcoin from the exchanges.
Conclusion
Combining these two on-chain indicators, we can say bitcoin is very close to the bottom. How close? We don’t know. But timing the market can be futile in times of such uncertainty. Wise investors say “time in the market can beat timing the market”.
Also, a good DCA strategy is to buy $BTC when it goes below the $20k range and take profits on relief rallies. Therefore, it is best to DCA in and out when the market is extremely good or bad. And remember, these types of extreme market conditions never last long.
Win $6,699 worth of bonuses in the exclusive MEXC & Altcoin Buzz Giveaway! Find out more here.
For more cryptocurrency news, check out the Altcoin Buzz YouTube channel.
Find the most undervalued gems, up-to-date research and NFT buys with Altcoin Buzz Access. Join us for $99 per month now.

?")

 is a realistic tool to foresee the bear market bottom. But what is NUP? Decode the hidden on-chain indicators!)