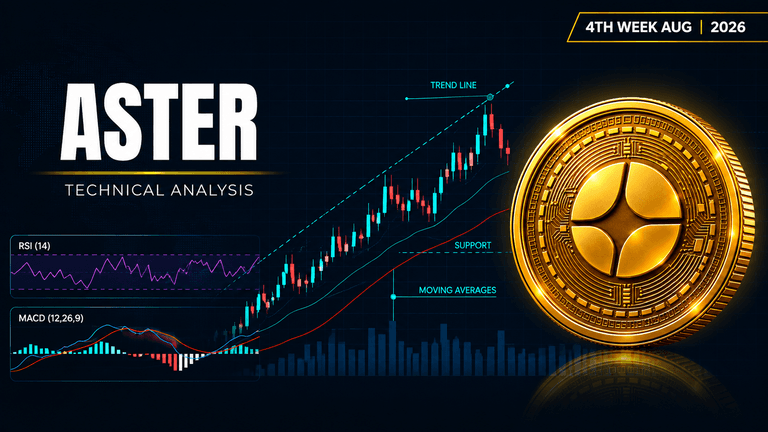
A classic chart pattern is signaling a potential move higher for ASTER this week.
Asset | ASTER (ASTER/USDT) |
Price at Analysis | $0.69 |
Timeframe | Daily candle |
Date | August 24, 2026 |
Bias | BULLISH |
My Trade | Long: double bottom breakout setup |
Cumulative Score | 7.2 / 10 |
200-day EMA | $0.66, price is above |
Bias Invalidation | Close below $0.66: the long-term trend support breaks |
ASTER is trading at $0.69 on the daily chart, sitting right at the upper band of its current trading range. The coin is roughly 14 percent below its recent swing high of $0.80, suggesting there is still upside room to explore. The overall market structure shows a coin that has been consolidating with support building in the low $0.60s, which is a constructive sign for bulls.
The weight of evidence across multiple indicators is decidedly bullish. Moving averages are stacked in bullish order, MACD momentum is positive and climbing, Bollinger Bands show price touching the upper band which often precedes a push higher, and volume is rising. The only weak spot is the cluster of resistance directly overhead, which could slow a rally. At a cumulative score of 7.2 out of 10, the setup is more bullish than bearish, and the presence of a textbook double bottom pattern adds confidence to the upside narrative.
RSI: momentum building but not yet extreme
RSI sits at 65.7, which puts it firmly in the positive zone above 50 but well shy of the overbought threshold of 70. This reading indicates steady upward momentum without the kind of stretched extreme that often precedes pullbacks. The meter has room to run higher, which is encouraging for bulls who want to see sustained strength.
Score: 7.5 / 10 | Bullish
Moving averages: perfectly stacked for a rally
The moving average lineup is textbook bullish. The 20-day EMA at $0.64 is above the 50-day at $0.63, both of which sit just below the 100-day at $0.64. The 200-day EMA at $0.66 is lower still, forming a clean upward stack. With price at $0.69 sitting above all four key moving averages, the macro trend is decidedly higher, and shorter-term pullbacks would likely find support on one of these levels.
Score: 9 / 10 | Bullish
Bollinger Bands: price at the upper rail
ASTER is touching the upper Bollinger Band at $0.69, with the mid-band at $0.62 and the lower band at $0.55 providing a defined trading range. When price reaches the upper band like this, it often signals the start of a fresh leg higher rather than an immediate reversal, especially when momentum indicators like RSI are not yet overbought. The bands show room to expand if volatility increases.
Score: 9 / 10 | Bullish
Fibonacci: price between key retracement zones
Measured from the swing low of $0.59 to the swing high of $0.80, price at $0.69 sits almost exactly at the 0.500 Fibonacci retracement level. Above lies the 0.618 level at $0.72 and the 0.786 level at $0.76, both of which could serve as targets if momentum continues. The Fibonacci setup is mixed because price is at a midpoint rather than at a strong confluent level, but the upside targets are clearly defined.
Score: 5.5 / 10 | Neutral
Support levels: solid floor beneath current price
Support sits at $0.69, $0.66, and $0.61. The first level at $0.69 is right at current price, serving as an immediate anchor. The $0.66 level aligns closely with the 200-day EMA, making it a strong macro support zone. The $0.61 level provides a third line of defense and gives bulls confidence that downside risk is contained if price does pull back.
Score: 7.5 / 10 | Bullish
Resistance: overhead supply is stacked tight
Resistance is clustered densely just above current price at $0.70, $0.74, and $0.78. The immediate hurdle at $0.70 is only one cent away and could slow momentum. The proximity of these levels means a break through one could quickly lead to a test of the next, but the concentration of supply overhead is the main reason the resistance score is low. This is the bull's main obstacle to a sustained rally.
Score: 3 / 10 | Bearish
Trendline: ascending path still intact
The dominant trendline is ascending with a base at $0.64, meaning price is above this support line and the trend structure remains constructive. As long as ASTER holds above $0.64 on any pullback, the uptrend remains in force. This gives bulls a clear level to defend, and any bounce off the trendline would add to the bullish case.
Score: 8 / 10 | Bullish
MACD: positive momentum with room to extend
The MACD line at 0.016306 is above the signal line at 0.006337, generating a bullish crossover signal. The histogram at 0.009969 is positive and growing, which means momentum is not only bullish but also accelerating. This is one of the cleaner bullish signals in the indicator suite and suggests the up move still has fuel.
Score: 8.5 / 10 | Bullish
On-balance volume: accumulation is underway
On-balance volume is in an uptrend, which means buyers are stepping in as price rises rather than selling into strength. This is a bullish divergence confirmation, showing that the price move upward is backed by genuine buying interest and not just momentum chasing. Rising OBV alongside rising price is the hallmark of healthy uptrends.
Score: 7 / 10 | Bullish
Chart patterns: double bottom formation complete
A double bottom pattern has formed, where price found support near $0.59 twice before bouncing. This is a classic reversal pattern that signals a shift from bearish to bullish momentum. The pattern's measured target would be approximately the height of the pattern added to the breakout level, suggesting potential targets in the $0.75 to $0.80 zone, which aligns with the recent swing high.
Score: 6.5 / 10 | Bullish
Indicator | Reading | Score / 10 |
|---|---|---|
RSI (14) | Strong but not overbought at 65.7 | 7.5 |
EMAs (20 / 50 / 100 / 200) | Perfectly stacked bullish alignment | 9 |
Bollinger Bands | Price at upper band with room to expand | 9 |
Fibonacci | At 0.500 level with defined targets above | 5.5 |
Support | Three solid levels with $0.66 EMA confluence | 7.5 |
Resistance | Tight cluster at $0.70, $0.74, $0.78 | 3 |
Trendline | Ascending trend intact above $0.64 support | 8 |
MACD | Bullish line above signal with growing histogram | 8.5 |
On-Balance Volume | Rising trend confirms accumulation | 7 |
Chart Patterns | Double bottom with defined measured targets | 6.5 |
Cumulative Average | BULLISH bias: I'm going long | 7.2 |
I'm going long here because ASTER is showing textbook double bottom confirmation with all the moving averages stacked bullish and MACD momentum building. The cumulative score of 7.2 out of 10 is solidly bullish, and I see defined support below and clear targets above. The risk is contained by the strong support levels, and the reward potential reaches toward the $0.74 to $0.76 zone in the near term, with the $0.80 swing high as a longer-term target.
My entry zone | $0.68 – $0.70 |
My stop loss | $0.63 (loses the long-term 200-day EMA trend anchor) |
My target 1 | $0.72: Fibonacci 0.618 level |
My target 2 | $0.76: Fibonacci 0.786 and pattern target zone |
My target 3 | $0.80: Swing high and double bottom measured target |
Risk : Reward | 1 : 2.25 (T2) / 1 : 3.4 (T3) |
Position | Long: leveraged long acceptable for 7-day timeframe |
I would exit or flip my position if price closes below the $0.66 level, which is where the 200-day EMA support sits. If that level breaks, the longer-term trend structure is compromised and the bullish case unravels. Additionally, if price closes below the ascending trendline at $0.64, I would consider my thesis invalidated and would either exit or reduce to a much smaller position. My thesis assumes that the double bottom holds and buyers defend the moving average stack, so any violation of those levels tells me I was wrong about the near-term direction.
Disclaimer: This article is produced for informational and educational purposes only and does not constitute financial or investment advice. Cryptocurrency markets are highly volatile and carry significant risk. Always conduct your own research and consult a qualified financial adviser before making any trading decisions.
This altcoin is flashing green signals across nearly every indicator, but one major warning sign could derail the upside.
 STG
STG
A small altcoin is staging a quiet rally. Here's why traders are watching closely.
 ZBCN
ZBCN-768x432.png&w=3840&q=75&dpl=dpl_2a1LjK7J47ZhhwjhB7eFPuxwceT3)
A small-cap token just flipped bullish. Most traders haven't noticed yet.
 INIT
INIT
