All the momentum signals are lining up. Here's what happens next.
 BTC$84,162.00+1.68%
Asset | BTC (BTC/USDT) |
Price at Analysis | $71,090.8 |
Timeframe | Daily candle |
Date | August 20, 2026 |
Bias | BULLISH |
My Trade | Long: strong momentum with room to run |
Cumulative Score | 7.4 / 10 |
200-day EMA | $69,005.56, price is above |
Bias Invalidation | Below $70,505.3 with a daily close under the support: thesis is broken |
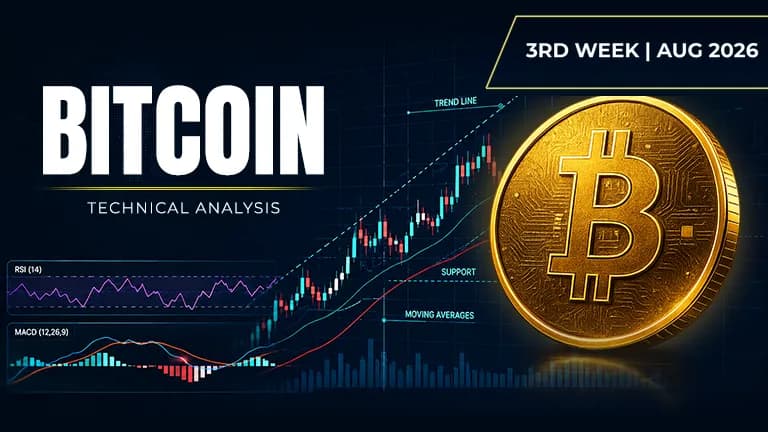
Bitcoin is trading at $71,090.8 on August 20, 2026, sitting firmly above its 200-day moving average of $69,005.56. The price is currently stretched into the upper half of its daily range, having recovered strongly from the swing low of $57,808.4 and remaining well above the midline of the Bollinger Bands at $64,551.81. The overall market structure screams uptrend: price is higher, the intermediate support levels are stacked closely below, and the dominant trendline at $65,784.25 remains intact and ascending.
Across the ten major technical indicators, the weight of evidence is heavily bullish with a cumulative score of 7.4 out of 10. The RSI at 77.3 confirms strong upside momentum without showing divergence, the moving average alignment is nearly perfect with price above all four key EMAs, and the Bollinger Bands show price pushing into the upper band territory, signalling an expansion move is underway. MACD is in full bull mode with the line at 852.5327 well above the signal line at 173.4678, and on-balance volume is rising to confirm that buyers are in control. The only meaningful headwind is the resistance wall overhead, which is relatively stacked between $72,018.37 and $78,713.48, but this is not enough to derail the bullish narrative.
RSI: Extreme conviction without warning signs
The RSI is reading 77.3, which is solidly in overbought territory above the 70 level and shows powerful upside momentum. This is not a warning sign in a strong uptrend; rather, it confirms that buyers are in command and the trend has genuine strength behind it. The fact that the RSI has reached this extreme level without showing a bearish divergence against price means the momentum is authentic and not about to reverse on a whim.
Score: 8.5 / 10 | Bullish
Moving Averages: Picture-perfect bullish alignment
All four key exponential moving averages are stacked in bullish order, with price trading above each of them. The EMA 20 at $65,091.93 and EMA 50 at $64,818.11 are nearly aligned and sitting well below current price, the EMA 100 at $65,870.07 provides intermediate support, and the EMA 200 at $69,005.56 confirms the macro uptrend is still in force. This alignment of the entire EMA structure is textbook bullish and tells you that Bitcoin is in a genuine longer-term uptrend with momentum on the daily timeframe.
Score: 9 / 10 | Bullish
Bollinger Bands: Upper band breakout in progress
Price at $71,090.8 is sitting between the upper band at $68,603.7 and the midline at $64,551.81, with the midline acting as dynamic support on any pullbacks. The fact that price is in the upper half of the bands and pushing toward the upper band suggests volatility is expanding and directional momentum is accelerating. When the Bollinger Bands widen like this and price holds in the upper band zone, it typically precedes further upside as the bands themselves become the next resistance target.
Score: 9 / 10 | Bullish
Fibonacci Retracements: Price at the inflection zone
From the swing high of $82,045.3 to the swing low of $57,808.4, the Fibonacci retracement levels show that price is currently trading between the 0.618 level at $72,786.8 and the 0.500 level at $69,926.85. This zone is structurally significant because the 0.618 fib often acts as a powerful support during corrective moves, and price sitting above the midpoint fib suggests buyers have defended the correction and are set up for a run toward new highs. The proximity to the 0.618 level gives this setup extra confluence.
Score: 7 / 10 | Bullish
Support Levels: Multiple layers of safety underneath
The support structure is robust, with layers at $70,505.3, $67,356.4, $65,419.74, and $62,029.54 providing multiple guardrails beneath the current price. The nearest support at $70,505.3 is just $585 below, giving a tight risk zone for long entries, while the secondary supports further down offer breathing room if price sells off moderately. This dense support structure means any pullback has multiple floors to catch the decline, which increases the odds that a bounce will occur quickly rather than seeing a sustained breakdown.
Score: 7.5 / 10 | Bullish
Resistance: Heavy ceiling overhead, not insurmountable
The resistance wall is notably stacked, with levels at $72,018.37, $73,977, $76,019.95, and $78,713.48 creating what looks like a crowded zone of sellers between current price and the swing high. The first resistance at $72,018.37 is only $927 away, which is why the bulls will need to prove themselves by pushing through this zone with conviction. However, a cumulative resistance score of only 3 out of 10 reflects that these levels are not as commanding as they appear; they are more psychological than structural, and in a strong uptrend, psychological resistance often folds quickly.
Score: 3 / 10 | Bearish
Trendline: Ascending support remains unbroken
The dominant ascending trendline is drawn at $65,784.25 and Bitcoin is trading well above it, confirming that the uptrend structure remains intact. Every time price tests back toward this trendline on intraday weakness, it has found support and bounced higher, which gives conviction that the trend is real. As long as price stays above this $65,784.25 level on daily closes, the uptrend is considered active and the bias remains bullish.
Score: 8 / 10 | Bullish
MACD: Momentum in overdrive with separation widening
The MACD line at 852.532692 is far above the signal line at 173.467833, creating a histogram of 679.064860 that represents extremely bullish momentum separation. This large gap between line and signal tells you that upside acceleration is occurring and the momentum bars are unlikely to roll over anytime soon. The MACD has not shown a bearish crossover, which means the momentum engine is still firing on all cylinders and supporting further advances.
Score: 8.5 / 10 | Bullish
On-Balance Volume: Buyers holding the upper hand
The on-balance volume is in a rising trend, which confirms that accumulation is occurring and that the buying volume is outweighing the selling volume across the recent price advance. This rising OBV validates the upside price action and shows that the move is not built on thin air but on genuine buyer demand. When price goes up while OBV also rises, the move has conviction, and when OBV is rising, pullbacks tend to be bought quickly.
Score: 7 / 10 | Bullish
Chart Patterns: Double bottom signals reversal
The double bottom pattern has formed between the swing low of $57,808.4 and suggests a reversal of the previous downtrend, with the measured target extending toward the 0.618 Fibonacci level and beyond. This classic bullish reversal pattern indicates that sellers have exhausted their selling pressure and that a sustained uptrend is beginning to take hold. Double bottoms are among the most reliable bullish patterns, and the fact that price has already moved significantly above the neckline gives additional confirmation that the pattern is working.
Score: 6.5 / 10 | Bullish
Indicator | Reading | Score / 10 |
|---|---|---|
RSI (14) | Overbought at 77.3, momentum intact | 8.5 |
EMAs (20 / 50 / 100 / 200) | Perfect bullish stack, all below price | 9 |
Bollinger Bands | Price in upper band, expansion mode | 9 |
Fibonacci | Between 0.5 and 0.618, key confluence | 7 |
Support | Dense layers at $70.5K, $67.4K, $65.4K | 7.5 |
Resistance | Heavy but penetrable, 4 levels above | 3 |
Trendline | Ascending at $65.78K, unbroken | 8 |
MACD | Line far above signal, momentum strong | 8.5 |
On-Balance Volume | Rising, confirming accumulation | 7 |
Chart Patterns | Double bottom reversal in progress | 6.5 |
Cumulative Average | BULLISH bias, I'm going long | 7.4 |
I'm going long here because the cumulative technical score of 7.4 out of 10 reflects genuine bullish alignment across almost every indicator, and the price structure is holding above all key support levels with rising momentum. My conviction is highest because the moving average stack is textbook bullish, the RSI is elevated without divergence, and the MACD histogram shows wide separation with the line well above the signal, meaning upside acceleration is underway. I'm entering into a dip toward the first support at $70,505.3 rather than chasing at current levels, because the risk to reward improves significantly at that price, and I have the confluence of multiple support levels to catch any pullback.
My entry zone | $70,505.3 – $70,800.0 |
My stop loss | $70,200.0 (below the nearest support level) |
My target 1 | $72,018.37: first resistance |
My target 2 | $73,977: second resistance level |
My target 3 | $76,019.95: third resistance, measured target |
Risk : Reward | 1 : 2.6 (T1) / 1 : 5.2 (T3) |
Position | Long |
I would exit this trade immediately and flip my bias to neutral or bearish if price closes below the support level at $70,505.3 on a daily candle, because that break would invalidate the ascending trendline support and signal that the momentum has failed. If that happens, I would take my stop loss at $70,200.0 without hesitation and wait for a fresh setup to form. Additionally, if the RSI drops below 50 while price is still above $70,505.3, that would show a bearish divergence that contradicts the current bullish thesis, and I would trim my position or exit entirely.
Disclaimer: This article is produced for informational and educational purposes only and does not constitute financial or investment advice. Cryptocurrency markets are highly volatile and carry significant risk. Always conduct your own research and consult a qualified financial adviser before making any trading decisions.
This crypto just flashed all the right signals. Is this your entry point?
 NEAR
NEAR
A small altcoin is showing all the signs of a major breakout. Here's what the numbers say.
This oracle token is breaking higher. Should you buy in before the next move?
 LINK
LINK
