Cash Cat price is quietly building momentum: here's what I'm watching over the next 24 hours.
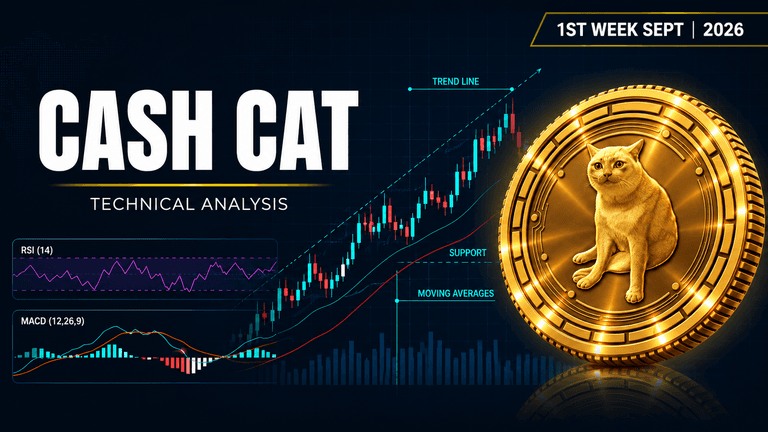
 CASHCAT$0.120283+8.87%
Asset | CASHCAT (CASHCAT/USDT) |
Price at Analysis | $0.22 |
Timeframe | 4h candle |
Date | September 1, 2026 |
Bias | BULLISH |
My Trade | Long: Strong EMA alignment with bullish confluence |
Cumulative Score | 5.9 / 10 |
200-day EMA | $0.13, price is above |
Bias Invalidation | Close below $0.18 with a break of the swing low structure |
CASHCAT price is trading at $0.22 on the 4-hour timeframe, sitting comfortably above a cluster of key moving averages and holding inside a tight Bollinger Band range. The token is trading $0.04 below its recent swing high of $0.26, which suggests we're still in a recovery phase after a broader pullback from earlier highs. The overall market structure feels constructive: price action has formed a Double Bottom pattern, and the asset is trading within an ascending trendline, both classic signs that buyers are regaining control.
The weight of evidence across our ten major indicators tells a cautiously optimistic story. Moving averages are perfectly stacked (EMA 20 above EMA 50 above EMA 100 above EMA 200), MACD is in early positive divergence with the histogram expanding, Fibonacci retracements place price in a structural sweet spot between the 0.618 and 0.786 levels, and chart patterns suggest a breakout is brewing. However, this bullish setup comes with a notable caveat: On-Balance Volume is falling, resistance overhead is tightly packed, and support levels feel somewhat fragile. This is a trade that requires active management and discipline.
RSI: Momentum climbing but still in neutral territory
The RSI (14) is reading 54.0, which means Cash Cat price is hovering right around the 50 midpoint without tipping into overbought territory above 70. This neutral reading actually works in favor of bulls, because it tells us there is still room for momentum to build higher before we hit exhaustion. The RSI is not rolling over or showing any signs of negative divergence against price, which keeps the door open for a continued climb in the coming hours.
Score: 6 / 10 | Bullish
Moving Averages: Cash Cat price in pristine bullish alignment
Cash Cat price is trading above all four major moving averages, and they are stacked in the ideal bullish order: EMA 20 at $0.21, EMA 50 at $0.20, EMA 100 at $0.17, and EMA 200 at $0.13. Every single average is below the current price of $0.22, which is textbook momentum structure. The 200-day EMA sits at $0.13, and price trading well above this macro support level indicates we are in a well-established uptrend on the longer timeframe. This EMA alignment is one of the strongest bullish signals in the entire analysis.
Score: 9 / 10 | Bullish
Bollinger Bands: Price holding the midline with room to expand
Cash Cat (CASHCAT) to USD is currently trading right at the Bollinger Band midline of $0.21, with the upper band sitting at $0.24 and the lower band at $0.18. This central positioning tells us that volatility is moderate, not extreme, and that price has plenty of upside runway before hitting the upper band. A close above $0.23 would position us to challenge the upper Bollinger Band at $0.24, which would be the next logical technical target in a sustained rally.
Score: 6 / 10 | Bullish
Fibonacci Retracements: Price locked in the bullish zone
The Fibonacci retracements between the swing low of $0.06 and the swing high of $0.26 show that Cash Cat crypto price is currently positioned between the 0.618 level at $0.18 and the 0.786 level at $0.21. This zone is where smart traders expect price to find support and accumulate before the next impulse higher. The fact that price is holding above both the 0.382 level ($0.13) and the 0.500 level ($0.16) without a close below these key Fibonacci zones strengthens the bullish case. For Cash Cat price prediction 2026, holding above the 0.618 Fibonacci level would be critical to sustained upside momentum.
Score: 9 / 10 | Bullish
Support Levels: Foundation is weaker than bulls would like
The nearest support levels sit at $0.18 and $0.14, both of which are clustered (two levels at each price point). While $0.18 is only $0.04 below the current price, this support zone feels fragile because price has not spent enough time consolidating above it to build strong conviction. If Cash Cat price breaks below $0.18 on a close, the next meaningful support is at $0.14, which is a $0.08 drop from here. This is why the low cumulative support score of 3.5 reflects the reality that bulls need to defend $0.18 aggressively or risk a deeper pullback.
Score: 3.5 / 10 | Bearish
Resistance: Overhead supply is thick and layered
Resistance levels are stacked at $0.23, $0.24, $0.24, and the swing high at $0.26. This clustering of resistance means that any rally faces multiple layers of selling pressure in a relatively tight $0.03 band. The double resistance at $0.24 is particularly significant, as it suggests institutional or algorithmic selling is likely to cluster at this level. For bulls to deliver a clean breakout, they will need to punch through $0.24 convincingly and close above $0.26, otherwise price could roll over and retest support.
Score: 3 / 10 | Bearish
Trendline: Ascending trend but price is approaching the line
The dominant trendline is ascending and sits at $0.23, which means price is currently trading just $0.01 below this key technical level. While the uptrend is intact, the fact that price is bumping up against the trendline resistance suggests we are at a critical decision point. A break above $0.23 would reaffirm the trendline and likely accelerate the rally, but a failure here could result in a short-term pullback to retest the $0.18 support zone. The trendline score of 4 reflects this precarious positioning.
Score: 4 / 10 | Bearish
MACD: Bullish crossover unfolding with positive histogram expansion
The MACD line at 0.004208 is sitting above the signal line at 0.003265, and the histogram is positive at 0.000943 with the bars expanding. This is the early stage of a bullish MACD setup, where momentum is accelerating into the upside and the indicator is confirming the uptrend. The positive histogram expansion is particularly constructive because it tells us that buying pressure is growing rather than fading. Why is Cash Cat (CASHCAT) price rising: this MACD structure is showing that fresh bullish momentum is entering the market.
Score: 8.5 / 10 | Bullish
On-Balance Volume: Falling OBV contradicts the bullish price structure
On-Balance Volume is trending lower, which is the primary red flag in this otherwise bullish analysis. While price is higher and moving upward, the OBV is falling, which suggests that volume is not confirming the rally and that distribution could be happening into the strength. This divergence between rising price and falling OBV is a warning sign that the bull move could lack staying power, especially if price encounters the resistance cluster at $0.23 and $0.24. This is the kind of warning that separates casual traders from disciplined ones.
Score: 3 / 10 | Bearish
Chart Patterns: Double Bottom and Triangle suggest breakout energy
The Double Bottom pattern is a classic reversal formation that suggests price has found a floor and is ready to march higher. The Symmetrical Triangle is forming tighter and tighter with each passing candle, which means we are approaching an inflection point where price will either break up or down decisively. The measured target for a Double Bottom rally would take us well above the current resistance cluster, potentially toward $0.30 or higher if the breakout sustains. The CASHCAT price analysis and chart patterns suggest we are in the early innings of a potential move.
Score: 6.5 / 10 | Bullish
Indicator | Reading | Score / 10 |
|---|---|---|
RSI (14) | At midpoint with room to climb | 6 |
EMAs (20 / 50 / 100 / 200) | Perfect bullish stack, price well above all | 9 |
Bollinger Bands | Centered with upper band at $0.24 | 6 |
Fibonacci | Sweet spot between 0.618 and 0.786 | 9 |
Support | Clustered but fragile below $0.18 | 3.5 |
Resistance | Tightly layered at $0.23 to $0.26 | 3 |
Trendline | Ascending but price touching the line | 4 |
MACD | Positive crossover with expanding histogram | 8.5 |
On-Balance Volume | Falling despite rising price, divergence warning | 3 |
Chart Patterns | Double Bottom and Triangle suggesting breakout | 6.5 |
Cumulative Average | BULLISH bias, I'm going long on this setup | 5.9 |
I'm going long here because the EMA stack is pristine, MACD is turning bullish, and the Double Bottom pattern is setting up a clean breakout setup. The Fibonacci zone between 0.618 and 0.786 is acting as a magnet for price, and I'm confident that a close above $0.23 and the ascending trendline will open the door to a run at the $0.24 resistance cluster. My cumulative score of 5.9 out of 10 tells me this is a setup worth taking, despite the OBV warning. I'm personally entering on a break above the trendline with a tight stop and three separate profit targets, because I want to buy Cash Cat crypto at the point where the technical structure is most favorable. For Cash Cat price prediction 2026, I expect this pattern to play out over the next 24 to 48 hours.
My entry zone | $0.22 – $0.23 |
My stop loss | $0.17 (break of $0.18 support on close) |
My target 1 | $0.24: resistance cluster |
My target 2 | $0.26: swing high and upper Bollinger Band |
My target 3 | $0.30: measured move from Double Bottom |
Risk : Reward | 1 : 2 (T1) / 1 : 4 (T2) |
Position | Long |
I would exit my position immediately if Cash Cat price closes below $0.18 on the 4-hour candle, because that would break the structural support and invalidate the entire bullish setup. My thesis would be proven wrong if the Double Bottom pattern fails to deliver a breakout and price instead rolls over from here and breaks back below the $0.16 Fibonacci 0.500 level. I would also consider flipping bearish if resistance holds at $0.24 for two consecutive candles and OBV remains in heavy downtrend, since that would signal that bulls are exhausted and distribution is underway. Is Cash Cat a good long-term investment: that's a question for another analysis, but for this 24-hour trade, I need price above $0.23 with volume confirmation to stay in the game.
Disclaimer: This article is produced for informational and educational purposes only and does not constitute financial or investment advice. Cryptocurrency markets are highly volatile and carry significant risk. Always conduct your own research and consult a qualified financial adviser before making any trading decisions.
A popular crypto token is caught between bullish patterns and bearish momentum. Which force wins?
 HYPE
HYPE
Ripple sits frozen between hope and caution as major signals clash over what comes next.
 XRP
XRP
Solana is at a crossroads. The charts are sending mixed signals about which way it breaks.
 SOL
SOL
