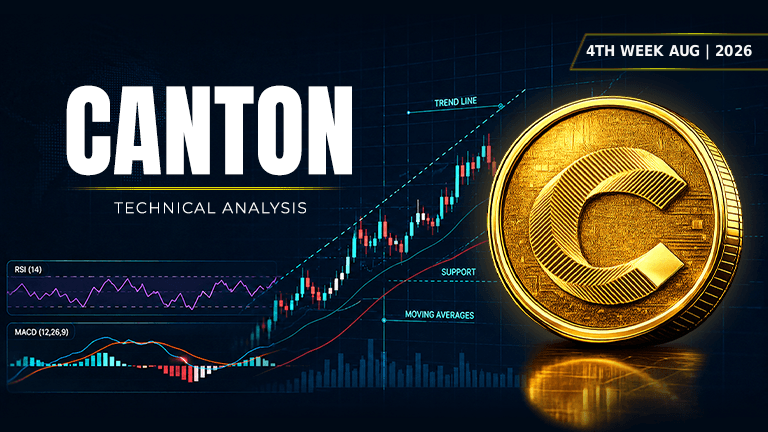
CC is sitting at a critical crossroads with bullish signals fighting against overhead resistance.
Asset | CC (CC/USDT) |
Price at Analysis | $0.12 |
Timeframe | Daily candle |
Date | August 27, 2026 |
Bias | BULLISH |
My Trade | Long: Momentum building toward resistance |
Cumulative Score | 6.1 / 10 |
200-day EMA | $0.14, price is below |
Bias Invalidation | Close below $0.10 on high volume |
CC is trading at $0.12, positioned between its 50-day moving average at $0.12 and a descending trendline at $0.10. The coin has moved $0.03 away from its recent swing low of $0.09 and is sitting comfortably above its first support zone. While the price is still $0.02 below the 200-day EMA of $0.14, the overall structure suggests consolidation rather than collapse, with multiple buyers defending the $0.12 level.
The weight of evidence tilts bullish, driven by strong MACD momentum, rising on-balance volume, and tight support clusters below current price. However, this optimism is tempered by resistance stacking overhead at $0.13 and $0.14, a descending trendline that still dominates the macro setup, and Fibonacci retracements suggesting limited upside into the near term. The RSI at 57.0 sits in neutral territory, avoiding both overbought extremes and oversold desperation, which preserves room for a directional move in either direction over the next seven days.
RSI: Neutral momentum with room to run
The RSI reading of 57.0 places CC in neutral territory, sitting comfortably above the 50 midpoint but well clear of the 70 overbought threshold. This suggests the current move is driven by genuine buying pressure rather than exhaustion or frenzy. There is no sign of divergence between price and the RSI, meaning the recent advance has real momentum backing it without yet hitting extremes that typically precede reversals.
Score: 6.5 / 10 | Bullish
Moving Averages: Price caught between uptrend and downtrend
CC sits exactly at its 50-day EMA of $0.12, while the 20-day EMA at $0.11 is below price and rising. The longer-term EMAs tell a different story: the 100-day at $0.13 and 200-day at $0.14 are both above price, signaling that the macro downtrend remains intact. Price is below three of the four moving averages, which is normally a bearish alignment, but the fact that price is now above the 50-day suggests short-term buyers are making a stand and may be gaining control.
Score: 5.5 / 10 | Neutral
Bollinger Bands: Price hugging the middle line
CC is trading near the middle Bollinger Band at $0.10, with the upper band at $0.13 and lower band at $0.08. The price sits $0.02 above the midline, indicating modest volatility rather than an extreme squeeze or a violent expansion. The bands are roughly symmetrical, which typically precedes a directional breakout once volatility awakens. Current positioning inside the bands, away from the outer edges, leaves room for a move toward either the upper or lower bands without immediately signaling reversal.
Score: 7.5 / 10 | Bullish
Fibonacci Retracements: Weak structure in the retest zone
The Fibonacci grid drawn from the swing high of $0.17 to the swing low of $0.09 places CC between the 0.236 level at $0.11 and the 0.382 level at $0.12. The 0.618 retracement sits at $0.14, exactly where the 200-day EMA trades. This alignment suggests the $0.14 zone is a critical structural level where macro resistance and Fibonacci confluence meet. If price reaches $0.14, buyers will need to prove they can hold it, as classical Fibonacci theory would expect a pause or reversal near the 0.618 golden ratio.
Score: 4 / 10 | Bearish
Support Levels: Strong floor underneath
CC has multiple support levels stacked at $0.12 (current price), $0.09, and a cluster of three at $0.09. The immediate support at $0.12 coincides with current price and the 50-day moving average, making this a natural zone where buyers could accumulate. The swing low support at $0.09 is $0.03 away and represents the lower boundary of the recent trading range. Having multiple confluences at $0.09 creates a strong floor if the bulls falter, meaning a trader going long here has defined risk with clear downside targets to watch.
Score: 7.5 / 10 | Bullish
Resistance: Crowded ceiling blocks immediate advance
Resistance is heavily stacked overhead, with three levels at $0.13 and one at $0.14, creating what traders call a 'wall' above current price. The $0.13 zone sits just $0.01 away and will be the first filter that bullish momentum must overcome. The $0.14 level coincides with the 200-day EMA and the 0.618 Fibonacci retracement, making it a major structural resistance where multiple forms of analysis converge. With three confluent resistance points above price and only one support point below, the risk-reward setup favors sellers until price breaks through these barriers.
Score: 3 / 10 | Bearish
Trendline: Descending trend still in control
The dominant trendline is descending and currently sits at $0.10, which is $0.02 below current price. This means price is trading above the macro trendline, which on first glance looks bullish. However, a descending trendline that still slopes downward from left to right means the long-term trend is still down. Price would need to definitively break above $0.14 and hold there on a close to signal a true reversal of the downtrend, whereas trading above a declining line at $0.10 is only a short-term relief, not a trend change.
Score: 6.5 / 10 | Bullish
MACD: Momentum is accelerating higher
The MACD line at 0.001848 has crossed above the signal line at -0.001395, generating a bullish crossover signal. The histogram is positive at 0.003242 and widening, which means momentum is not only bullish but actively accelerating. This is one of the strongest technical signals on the chart and suggests that buying pressure is genuine and building, not fading. When MACD is in a bullish crossover phase with an expanding positive histogram, it typically precedes meaningful price movement in the direction of the trend.
Score: 8.5 / 10 | Bullish
On-Balance Volume: Buyers are accumulating
OBV is in a rising trend, which means volume on up days is outpacing volume on down days. This is a sign of accumulation rather than distribution, suggesting smart money or early buyers are building positions at these levels. When price is rising and OBV is also rising, the move is considered more sustainable because it has volume backing it. If price had rallied but OBV was falling, it would signal a potentially hollow move likely to reverse, but that is not the case here.
Score: 7 / 10 | Bullish
Chart Patterns: No clear pattern signals direction
There is no recognizable chart pattern such as a double bottom, head and shoulders, triangle, or wedge currently forming on the daily timeframe. This lack of pattern definition means price action is still in a consolidation or early recovery phase rather than a structured breakout or breakdown setup. Without a pattern, traders cannot use measured move targets or classical pattern reversals to define their upside or downside objectives. However, the absence of a pattern does not negate the other technical signals, it simply means we must rely on support, resistance, moving averages, and momentum indicators rather than geometric structures.
Score: 5 / 10 | Neutral
Indicator | Reading | Score / 10 |
|---|---|---|
RSI (14) | Neutral zone, room to move either direction | 6.5 |
EMAs (20 / 50 / 100 / 200) | Mixed alignment, 50-day acting as support | 5.5 |
Bollinger Bands | Moderate volatility, middle band support | 7.5 |
Fibonacci | Between 0.236 and 0.382, weak retest setup | 4 |
Support | Multiple zones below, strong floor at $0.09 | 7.5 |
Resistance | Stacked at $0.13 and $0.14, hard ceiling | 3 |
Trendline | Price above descending trendline at $0.10 | 6.5 |
MACD | Bullish crossover with expanding histogram | 8.5 |
On-Balance Volume | Rising accumulation, volume supports price rise | 7 |
Chart Patterns | No clear pattern, consolidation phase | 5 |
Cumulative Average | BULLISH bias: I'm going long | 6.1 |
I'm going long here because the cumulative score of 6.1 out of 10 tilts toward the bulls, driven by a powerful MACD crossover, rising on-balance volume, and a price that has reclaimed the 50-day moving average at $0.12. My conviction sits at moderate-to-strong because momentum is genuinely building, but I acknowledge the significant resistance wall overhead at $0.13 and $0.14 that could cap my upside in the near term. I'm entering into this position with a clear defined risk level below, expecting the next seven days to either break decisively through that overhead supply or snap back down to test support.
My entry zone | $0.11 – $0.12 |
My stop loss | $0.09 (Swing low and support cluster breakdown) |
My target 1 | $0.13: First resistance confluence |
My target 2 | $0.14: 200-day EMA and 0.618 Fibonacci |
My target 3 | $0.17: Swing high and upper band zone |
Risk : Reward | 1 : 2 (T1) / 1 : 5 (T3) |
Position | Long |
I would exit or flip to short if price closes below $0.10 on high volume, because that would break the support cluster at $0.09 and take out the descending trendline with conviction. If the MACD momentum line rolls over and crosses back below the signal line while price is still below $0.13, I would see that as a loss of bullish momentum and a warning to reduce my position. My thesis is wrong if we see a daily close below $0.09 combined with OBV rolling over into a downtrend, which would signal that accumulation has failed and distribution is taking control.
Disclaimer: This article is produced for informational and educational purposes only and does not constitute financial or investment advice. Cryptocurrency markets are highly volatile and carry significant risk. Always conduct your own research and consult a qualified financial adviser before making any trading decisions.
This altcoin is flashing green signals across nearly every indicator, but one major warning sign could derail the upside.
 STG
STG
A small altcoin is staging a quiet rally. Here's why traders are watching closely.
 ZBCN
ZBCN-768x432.png&w=3840&q=75&dpl=dpl_2a1LjK7J47ZhhwjhB7eFPuxwceT3)
A small-cap token just flipped bullish. Most traders haven't noticed yet.
 INIT
INIT
