A small token is quietly building momentum. Here's what the charts reveal about what happens next.
 ETHFI$0.707448+15.17%
Asset | ETHFI (ETHFI/USDT) |
Price at Analysis | $0.58 |
Timeframe | Daily candle |
Date | September 2, 2026 |
Bias | BULLISH |
My Trade | Long: strong EMA structure and ascending trend |
Cumulative Score | 6 / 10 |
200-day EMA | $0.44, price is above |
Bias Invalidation | Below $0.51: breaks final support and closes beneath the ascending trendline |
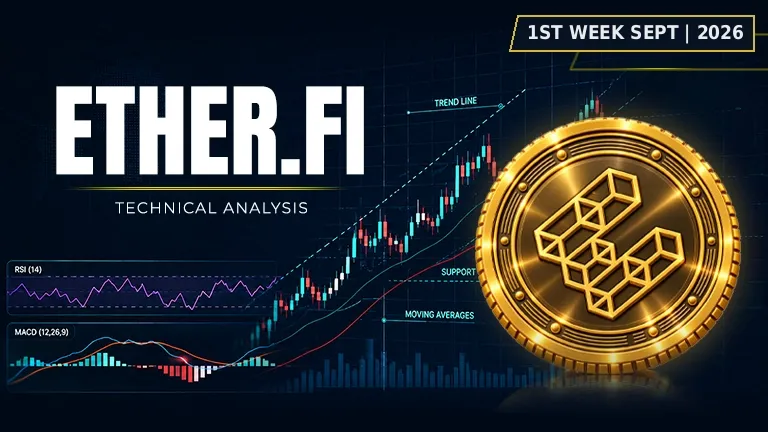
Ether.fi ETHFI price is currently trading at $0.58 on September 2, 2026, sitting comfortably above its major moving averages and holding above a strong ascending trendline. The token sits roughly 12% below its recent swing high of $0.66, suggesting room to run higher without having overextended itself. Market structure remains constructive, with price supported by a tight cluster of moving averages all pointing upward, indicating that Ether.fi crypto price momentum has shifted decisively into the bulls' favor.
The dominant technical narrative across the 10 indicators tilts bullish with a cumulative score of 6/10, driven by exceptional alignment in the moving averages, robust Fibonacci positioning, and a strong ascending trendline. However, this bullish case is tempered by weakness in momentum indicators: MACD is rolling over with a negative histogram, and on-balance volume is falling, suggesting that while price is rising, the buying pressure underneath may be softening. The Ether.fi price action itself tells a story of conviction above key moving average support, but the divergence between price and volume warns that not all bulls are convinced yet.
RSI: Why is Ether.fi (ETHFI) price rising right now?
The RSI sits at 61.3, which places the token comfortably above the 50 midline and firmly in bullish momentum territory without yet reaching overbought conditions above 70. This reading signals that buying pressure is present and sustained, but there is still runway before exhaustion signals would trigger. At this level, Ether.fi ETHFI price has momentum on its side, and the ascending slope of the RSI curve suggests that buyers are gradually taking control of the price action day by day.
Score: 7 / 10 | Bullish
Moving Averages: Ether.fi price prediction 2026 starts with EMA alignment
All four major moving averages are stacked in perfect bullish order: price at $0.58 sits above the EMA 20 at $0.54, which sits above the EMA 50 at $0.48, which sits above the EMA 100 at $0.45, which sits above the EMA 200 at $0.44. This is textbook bullish alignment, signaling that intermediate, medium, and long-term trends are all pointing upward. The 200-day EMA at $0.44 acts as a macro floor, and Ether.fi price sitting 32% above that level confirms we are well within a sustained uptrend. For Ether.fi price prediction 2026, this structure suggests the token should continue to find support around the $0.54 level, allowing for another push toward resistance.
Score: 9 / 10 | Bullish
Bollinger Bands: Ether.fi (ETHFI) to USD converges between support and resistance
Ether.fi (ETHFI) to USD is currently trading at $0.58, positioned slightly above the Bollinger Bands midline of $0.55 but well clear of the upper band at $0.64. This placement tells us that volatility is moderate, price is not overextended to the upside, and there is ample room before hitting the upper band, which would signal a climactic spike. The lower band sits at $0.46, offering a clear second layer of dynamic support beneath the moving average cluster. The bands are relatively tight, which typically precedes a breakout; if Ether.fi price can break above $0.59 resistance with volume, the upper band around $0.64 becomes the next logical target.
Score: 6 / 10 | Bullish
Fibonacci Retracements: Ether.fi price analysis and chart shows prime upside positioning
Using the swing low of $0.27 and swing high of $0.66, Ether.fi ETHFI price analysis and chart reveals that current price at $0.58 sits very close to the 0.786 Fibonacci level at $0.57. This is a critical zone in Fibonacci trading: the 0.786 level often acts as a springboard for extended moves higher, because traders who missed the initial move from $0.27 to $0.66 frequently enter fresh longs around this retracement. The fact that price is holding just above this level without falling back through it is a bullish sign. For Ether.fi price prediction 2030, holding this structure now suggests the foundation is being laid for much larger moves over the coming years.
Score: 9 / 10 | Bullish
Support Levels: Ether.fi price holds key floors for the short term
Ether.fi price currently has four layers of support beneath it: $0.55 (just $0.03 below current price), $0.54 (which coincides with the EMA 20), $0.52, and $0.51. The proximity of support at $0.55 and $0.54 is tight, which is both a strength and a weakness. On the positive side, these levels are close enough to the current price that they will be tested quickly if a pullback begins, making them ideal profit-taking zones for sellers but also ideal re-entry zones for buyers who missed this move. Below $0.51, support deteriorates significantly, and a breakdown beneath this level would invalidate the bullish thesis and threaten the ascending trendline itself.
Score: 5.5 / 10 | Neutral
Resistance: Ether.fi crypto price faces a stacked overhead zone
Ether.fi crypto price faces three resistance levels above current price: $0.59 (just $0.01 away), $0.66 (the recent swing high and upper Bollinger Band), and $0.70 (the ultimate breakout target). The immediate resistance at $0.59 will be the first test, and it is very close, meaning this could be resolved within the next day or two. The clustering of resistance at $0.66 is significant because it represents both the recent ceiling in price and a zone where sellers congregated before; breaking above this level on strong volume would be a bullish signal that confirms the trend is accelerating.
Score: 3 / 10 | Bearish
Trendline: Ether.fi ETHFI price riding ascending support with precision
The ascending trendline is currently positioned at $0.58, which is exactly where Ether.fi ETHFI price sits on September 2, 2026. This is not a coincidence but rather a sign of precision buying at a key technical level. Price is touching the trendline from above, confirming that buyers are defending this level and view it as a pivot point. As long as the trendline remains intact, it will continue to act as a dynamic floor that rises over time, allowing Ether.fi price to build higher lows and eventually climb toward the $0.66 and $0.70 resistance zones. A break below the trendline would signal a loss of uptrend momentum and would require a reassessment of the bullish thesis.
Score: 8 / 10 | Bullish
MACD: Momentum fading despite rising prices
The MACD line sits at 0.033362, while the signal line is at 0.037065, meaning the line is currently below the signal line by 0.003703. This is a bearish crossover setup, or at minimum a sign that momentum is losing steam even as price continues higher. The negative histogram value of 0.003703 confirms that MACD is rolling over, which often precedes a consolidation or pullback. This divergence between price strength and momentum weakness is a yellow flag, suggesting that the current rally may be losing fuel and that buyers should exercise caution near the $0.59 to $0.66 resistance zone.
Score: 4 / 10 | Bearish
On-Balance Volume: Buying pressure weakening under the surface
On-balance volume is displaying a falling trend, which is a significant red flag even though Ether.fi price continues to climb. This divergence suggests that price is rising on diminishing volume, a classic sign that the current move may be running out of steam or that the rally lacks the kind of heavy accumulation that would typically support a sustained breakout. When OBV falls while price rises, it often warns of a potential reversal or correction coming. For traders considering a buy setup on Ether.fi, the falling OBV is a reason to either wait for volume to confirm the breakout or to scale into positions rather than going all-in at current levels.
Score: 3 / 10 | Bearish
Chart Patterns: Ether.fi shows no defined pattern at present
Currently, there is no clear recognizable chart pattern forming on the daily timeframe for Ether.fi. The price is simply grinding higher along the ascending trendline without yet forming a flag, pennant, triangle, or other continuation structure. This lack of a defined pattern is neutral; it means price is in a quiet accumulation phase rather than in the midst of a textbook technical formation. For traders who rely on pattern-based entry signals, this is a reminder that sometimes the best opportunity is simply to trade the trendline and support/resistance levels rather than waiting for the perfect pattern to materialize.
Score: 5 / 10 | Neutral
Indicator | Reading | Score / 10 |
|---|---|---|
RSI (14) | Momentum above 50, room to run before overbought | 7 |
EMAs (20 / 50 / 100 / 200) | Perfect bullish alignment, price above all four | 9 |
Bollinger Bands | Midline cross with room to upper band | 6 |
Fibonacci | At 0.786 level, prime retracement zone | 9 |
Support | Four layers clustered at $0.55 to $0.51 | 5.5 |
Resistance | Three-tier zone from $0.59 to $0.70 | 3 |
Trendline | Ascending trendline intact, price at line | 8 |
MACD | Negative histogram, line below signal | 4 |
On-Balance Volume | Falling trend, bearish divergence with price | 3 |
Chart Patterns | No clear pattern, neutral structure | 5 |
Cumulative Average | BULLISH bias: I'm going long | 6 |
I'm going long here because the moving average structure is pristine, price is sitting right at the ascending trendline with room to run toward $0.66 and $0.70, and the cumulative score of 6/10 reflects enough bullish conviction to take on the risk. My entry is in the zone between $0.57 and $0.59, and I'm using the break of the $0.51 support level as my hard stop, which keeps my risk defined and my position sized appropriately for a day or two of holding time.
My entry zone | $0.57 – $0.59 |
My stop loss | $0.50 (final support below the ascending trendline) |
My target 1 | $0.64: upper Bollinger Band |
My target 2 | $0.66: recent swing high and resistance |
My target 3 | $0.70: breakout target above all resistance |
Risk : Reward | 1 : 1.4 (T1) / 1 : 2.0 (T2) |
Position | Long / leveraged long |
I would exit my long position or flip to neutral if Ether.fi price closes below $0.51 on a daily candle, because that break would violate the ascending trendline and destroy the bullish moving average structure that forms the thesis for this trade. If price falls below $0.51 with heavy volume, it would signal that the uptrend has failed and the next target becomes $0.45 (the EMA 100), which would represent a fresh buying opportunity at a much lower level. My thesis is wrong if OBV continues to fall while price tries to break $0.59, because that would confirm that buyers are losing conviction and I would rather cut the position early than ride a topping move down.
Disclaimer: This article is produced for informational and educational purposes only and does not constitute financial or investment advice. Cryptocurrency markets are highly volatile and carry significant risk. Always conduct your own research and consult a qualified financial adviser before making any trading decisions.
A popular crypto token is caught between bullish patterns and bearish momentum. Which force wins?
 HYPE
HYPE
Ripple sits frozen between hope and caution as major signals clash over what comes next.
 XRP
XRP
Solana is at a crossroads. The charts are sending mixed signals about which way it breaks.
 SOL
SOL
