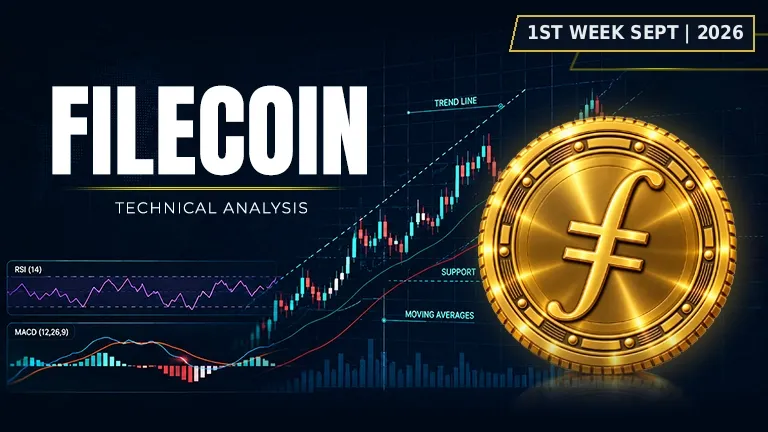
A forgotten storage coin is showing unexpected strength. Should you pay attention?
 FIL$1.15+9.20%
Asset | FIL (FIL/USDT) |
Price at Analysis | $0.80 |
Timeframe | Daily candle |
Date | September 2, 2026 |
Bias | BULLISH |
My Trade | Long: momentum divergence with rising momentum |
Cumulative Score | 6 / 10 |
200-day EMA | $0.85, price is below |
Bias Invalidation | Close below $0.70 on high volume |
The Filecoin FIL price is trading at $0.80 on September 2, 2026, positioned between a descending trendline at $0.73 and the first major resistance at $0.82. This sits comfortably above the swing low of $0.61 established earlier in the trend, meaning Filecoin has recovered meaningful ground from its lows. The asset is currently $0.25 away from its swing high of $1.10, suggesting there is substantial upside available if momentum sustains.
Across ten major technical indicators, the weight of evidence points to early bullish pressure building beneath the surface. The Filecoin price is supported by a bullish MACD setup, a moderately overbought RSI that still has room to run, and well-structured moving average support. However, resistance overhead is relatively light, and volume confirmation via on-balance volume remains flat, creating a mixed but ultimately optimistic backdrop for traders willing to buy Filecoin crypto at current levels.
RSI: Why is Filecoin (FIL) price rising right now?
The RSI reading of 61.3 places Filecoin (FIL) to USD in a moderately bullish zone, above the neutral 50 level but well clear of overbought territory above 70. This tells me momentum is building but has not yet exhausted itself. The position of the Filecoin FIL price analysis and chart shows continued room for acceleration before any pullback becomes likely.
Score: 7 / 10 | Bullish
Moving Averages: Filecoin price prediction 2026 relies on trend structure
The EMA structure reveals price is above the EMA20 at $0.72 and EMA50 at $0.73, both in bullish alignment. However, the EMA100 sits at $0.76 and the EMA200 sits at $0.85, putting Filecoin price below its longer-term average. This creates a tiered support zone as price climbs, while the gap between current price and the 200-day moving average represents the macro downtrend that must eventually be reclaimed. For Filecoin price prediction 2026, breaking above $0.85 would be the critical inflection point for longer-term investors.
Score: 7 / 10 | Bullish
Bollinger Bands: Volatility tightening into a breakout?
Price at $0.80 sits near the upper band at $0.81, with the midline at $0.71 and lower band at $0.61. This means Filecoin is trading in the upper half of its volatility range, suggesting strength, but the bands are relatively tight. A close above the upper band would confirm breakout momentum, while rejection could see price collapse back toward the lower support zone.
Score: 7.5 / 10 | Bullish
Fibonacci Retracements: Measuring the recovery zone
Using the swing high of $1.10 and swing low of $0.61, the Fibonacci grid shows price is currently trading near the 0.382 retracement level at exactly $0.80. This is a classic Fibonacci support zone in a recovery structure. Above this point lies the 0.500 retracement at $0.86 and the 0.618 at $0.91. The Fibonacci projection suggests limited explosive upside unless price breaks into untested territory above $1.00, which is why Fibonacci scores lower at 4 out of 10.
Score: 4 / 10 | Bearish
Support Levels: Is Filecoin a good long-term investment from these prices?
Multiple support levels are stacked beneath current price: $0.77, $0.74, $0.72, and $0.70 form a support cluster roughly 7 to 10 cents below entry. This is encouraging for risk management; a tight stop at $0.70 gives traders a defined risk zone while maintaining exposure to upside. These levels suggest the downside is protected if the bullish thesis plays out. Whether Filecoin is a good long-term investment depends on whether these supports hold as the price attempts to reclaim the $0.85 EMA200 level.
Score: 6.5 / 10 | Bullish
Resistance: How much ceiling is really overhead?
Resistance sits at $0.82, $0.86, $0.93, and $0.95, stacked progressively higher. The first resistance at $0.82 is only 2 cents away, making it the immediate hurdle. The concentration of resistance levels between $0.82 and $0.95 suggests the market has decided to cap rallies in this region historically. For buy Filecoin crypto trades, these overhead levels represent the ceiling that must be conquered for a real trend reversal.
Score: 3 / 10 | Bearish
Trendline: Breaking the downtrend or just a bounce?
The descending trendline is drawn at $0.73, placing price $0.07 above it. This is a shallow margin of victory. If the Filecoin FIL price closes below $0.73, the trendline reasserts control and suggests the downtrend remains intact. A decisive close above $0.82 would suggest the trendline has been broken for good and a new uptrend is beginning.
Score: 6.5 / 10 | Bullish
MACD: Momentum is the most bullish signal on the board
The MACD line sits at 0.006471 above the signal line at -0.000255, with a positive histogram of 0.006726. This bullish crossover is the strongest technical signal in the entire analysis. MACD momentum is accelerating upward, which typically precedes price moves. This is the reason my cumulative score leans bullish despite the resistance overhead and the mixed picture from other indicators.
Score: 8.5 / 10 | Bullish
On-Balance Volume: Accumulation or distribution?
On-balance volume is currently flat, meaning neither buyers nor sellers have taken decisive control through volume. This is neither a bullish nor bearish signal on its own. Ideally, a bullish setup would see volume increase into price resistance, confirming demand. The flat OBV suggests the current move may lack the institutional follow-through needed to sustain a major breakout.
Score: 5 / 10 | Neutral
Chart Patterns: No clear pattern means no measured target
There is no clear recognizable pattern on the daily chart at this moment. The price action does not form a cup and handle, a double bottom, a triangle, or any other classic reversal or continuation structure. This means traders cannot rely on a textbook measured move to set realistic profit targets. The lack of pattern is why this indicator scores 5 out of 10: it removes the framework we typically use to project how far a move can extend.
Score: 5 / 10 | Neutral
Indicator | Reading | Score / 10 |
|---|---|---|
RSI (14) | Moderately bullish, above 50 but below overbought | 7 |
EMAs (20 / 50 / 100 / 200) | Price above 20 and 50, below 100 and 200, tiered support | 7 |
Bollinger Bands | Trading upper band, strength confirmed, tight volatility | 7.5 |
Fibonacci | At 0.382 retracement, limited upside projection | 4 |
Support | Four-tier cluster between $0.70 and $0.77, tight risk zone | 6.5 |
Resistance | Stacked between $0.82 and $0.95, overhead supply heavy | 3 |
Trendline | Price above descending trendline at $0.73, shallow margin | 6.5 |
MACD | Bullish crossover, momentum accelerating, strongest signal | 8.5 |
On-Balance Volume | Flat trend, no accumulation or distribution confirmed | 5 |
Chart Patterns | No recognizable pattern, no measured target available | 5 |
Cumulative Average | BULLISH bias with caution: I'm going long with defined risk | 6 |
I'm going long on Filecoin at $0.80 because the MACD momentum divergence is the strongest signal I see, and the cumulative score of 6 out of 10 gives me enough conviction to take a calculated risk. I'm entering near current price with a tight stop just below the support cluster, and I'm targeting the resistance levels overhead as my first two exits. This is a scalp-to-swing trade, not a long-term hold, so I'm managing risk aggressively.
My entry zone | $0.78 – $0.82 |
My stop loss | $0.70 (break of support cluster invalidates thesis) |
My target 1 | $0.82 – first resistance |
My target 2 | $0.86 – EMA100 and Fibonacci 0.500 |
My target 3 | $0.95 – upper resistance zone |
Risk : Reward | 1 : 1.7 (T1) / 1 : 3.6 (T3) |
Position | Long / leveraged long |
I would exit or flip my position if Filecoin FIL price closes below $0.70 on elevated volume, as this would break the support cluster and suggest the downtrend is reasserting control. If the price fails to break above the $0.82 resistance after two closes and the MACD momentum rolls over, I would reduce my position size and lower my profit target expectations. My thesis is wrong if the Filecoin crypto price retests the $0.61 swing low, which would indicate the bounce is just a relief rally within a larger downtrend.
Disclaimer: This article is produced for informational and educational purposes only and does not constitute financial or investment advice. Cryptocurrency markets are highly volatile and carry significant risk. Always conduct your own research and consult a qualified financial adviser before making any trading decisions.
A popular crypto token is caught between bullish patterns and bearish momentum. Which force wins?
 HYPE
HYPE
Ripple sits frozen between hope and caution as major signals clash over what comes next.
 XRP
XRP
Solana is at a crossroads. The charts are sending mixed signals about which way it breaks.
 SOL
SOL
