Hyperliquid HYPE price stuck in neutral: here's what traders should watch!
A $80 cryptocurrency caught between bullish momentum and falling volume signals trouble ahead.

By Pratik OswalChief Technical Analyst
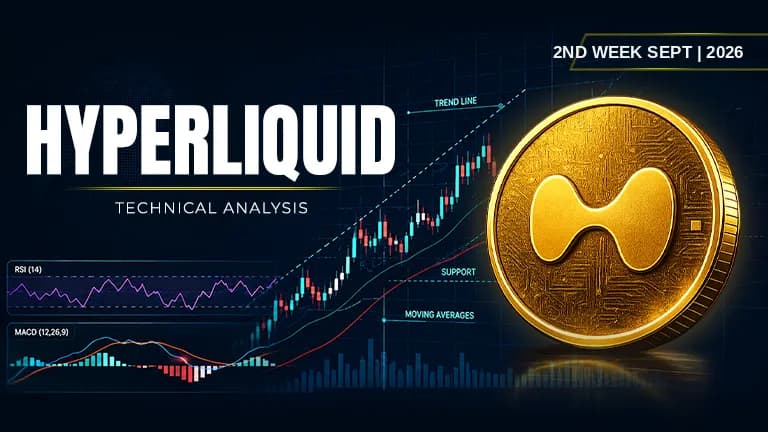
Asset | HYPE (HYPE/USDT) |
Price at Analysis | $80.86 |
Timeframe | Daily candle |
Date | September 10, 2026 |
Bias | NEUTRAL |
My Trade | Neutral: conflicting signals warrant caution |
Cumulative Score | 5.3 / 10 |
200-day EMA | $54.16, price is above |
Bias Invalidation | Close above $88.13 flips bullish; close below $78.58 flips bearish |
Overview
Hyperliquid HYPE price is currently trading at $80.86 on the daily timeframe, positioned comfortably above its 200-day exponential moving average at $54.16, which signals an intact longer-term uptrend structure. The coin sits roughly $8.83 below its recent swing high of $89.69, suggesting the rally has stalled in a consolidation zone rather than collapsing. Overall, the market sentiment is mixed: Hyperliquid price action suggests buyers are present but lacking conviction, and volume is declining into the resistance zone ahead.
The weight of evidence across all ten technical indicators yields a cumulative score of 5.3 out of 10, which translates to a neutral bias on the daily chart. Moving averages paint a decidedly bullish picture with price above all four major EMAs, yet Hyperliquid crypto price is being rebuked by a stacked resistance cluster, falling on-balance volume, and a MACD histogram that is now below its signal line. This disconnect between the bullish longer-term structure and the bearish near-term momentum means the next seven days will likely oscillate around the current level unless one of the invalidation triggers breaks the deadlock.
RSI: Neutral momentum without conviction
The 14-period RSI at 54.2 is sitting just above the midline at 50, which signals a neutral momentum state and the absence of overbought or oversold extremes. This reading tells us that neither buyers nor sellers are in control, and the coin remains in equilibrium. For Hyperliquid HYPE price analysis and chart interpretation, an RSI in this zone typically precedes a breakout in either direction once other catalysts appear.
Score: 6 / 10 | Bullish
Moving Averages: Bullish alignment with uptrend intact
Hyperliquid price is currently trading above all four major exponential moving averages: the EMA20 at $80.63, EMA50 at $72.83, EMA100 at $65.75, and EMA200 at $54.16, confirming a textbook bullish alignment. Each shorter-term average sits above the next longer-term one, which is precisely what traders want to see in an uptrend. The distance from the 200-day EMA of approximately $26.70 leaves ample room for pullbacks without breaking the macro uptrend, and this structure remains one of the strongest bullish arguments for Hyperliquid price prediction 2026 to continue higher over the medium term.
Score: 9 / 10 | Bullish
Bollinger Bands: Compression signals low volatility
The Bollinger Bands with an upper level of $88.08, middle band at $83.03, and lower level at $77.97 show that price is sitting just above the middle band, indicating low volatility and a tight trading range. When the bands narrow like this, it often precedes an expansion move, though the direction is uncertain. Hyperliquid HYPE price is not stretched to either extreme of the bands, which means it lacks the overextension that would signal either imminent reversal or continued breakout.
Score: 4.5 / 10 | Neutral
Fibonacci Retracements: Price between golden zone and 0.786 level
Measured from the swing low of $51.13 to the swing high of $89.69, Hyperliquid price sits between the 0.618 Fibonacci level at $74.96 and the 0.786 level at $81.44, placing it in a structurally significant zone known as the golden zone. This area often acts as both support and resistance in subsequent moves, and price respecting it here is a sign of healthy consolidation. If the coin breaks above $81.44, the next key Fibonacci targets would be the swing high and beyond, suggesting Hyperliquid price prediction 2030 could see substantially higher levels if this structural support holds.
Score: 8 / 10 | Bullish
Support Levels: Multiple cushions in place
Hyperliquid price has a robust support structure beneath the current level, with primary support at $78.58 just $2.28 below, secondary support at $65.92, and tertiary support at $61.75 and $60.61 further down. The proximity of the $78.58 level makes it a relatively tight stop-loss zone, and if this holds, it reinforces the structural strength of the uptrend. A break below $78.58 would be the first real warning sign that the consolidation is becoming a reversal, though the deeper supports provide multiple chances for buyers to step in.
Score: 6.5 / 10 | Bullish
Resistance: Heavy overhead supply, but why is Hyperliquid HYPE price dropping?
The resistance zone is stacked with four distinct levels: $83.41, $85.33, $86.80, and $88.13, creating a formidable supply zone that has repeatedly rejected price advances. This clustering of overhead sellers explains why Hyperliquid price has stalled near its recent highs, and it is precisely why asking why Hyperliquid HYPE price dropping is somewhat premature. The coin has not actually declined sharply; it has simply run into a wall of sellers and is consolidating. Breaking above $88.13 would be required for a fresh push toward the $89.69 swing high and beyond.
Score: 3 / 10 | Bearish
Trendline: Price below dominant ascending line
The ascending trendline sits at $90.18, and Hyperliquid price at $80.86 is currently trading approximately $9.32 below this technical reference line. This gap between price and the trendline signals that the recent rally has lost momentum and is no longer touching the uptrend structure. If price fails to reclaim the trendline within the next few candles, it could signal weakening momentum, though the trendline break itself would not automatically invalidate the longer-term uptrend given the distance from the 200-day EMA.
Score: 4 / 10 | Bearish
MACD: Histogram turns negative as momentum fades
The MACD line at 4.526808 is now sitting below the signal line at 5.506581, creating a negative histogram of minus 0.979773. This recent bearish crossover signals that momentum is rolling over, though the lines themselves remain positive, suggesting the uptrend is not yet broken. This divergence between the bullish price structure and the weakening momentum oscillator is the core reason for the neutral stance on Hyperliquid price action over the next week.
Score: 4 / 10 | Bearish
On-Balance Volume: Distribution trend confirms selling pressure
The On-Balance Volume indicator is showing a falling trend, which means that volume on down days is outweighing volume on up days, signaling net distribution and subtle selling pressure beneath the surface. This divergence between rising price and falling volume is a classic warning sign that enthusiasm is waning, even though price remains elevated. When OBV falls while price holds steady or rises, it often precedes weakness, making this one of the more bearish signals on the board.
Score: 3 / 10 | Bearish
Chart Patterns: No clear pattern yet, but consolidation may break soon
With no clear reversal or continuation pattern present on the daily chart as of September 10, 2026, the market is in a neutral holding phase. The absence of a defined pattern sometimes precedes explosive moves once price breaks out of consolidation, though it provides no directional clue beforehand. Traders watching for a pattern completion should monitor the next one to three candles to see if a recognizable structure emerges, such as a flag, wedge, or triangle.
Score: 5 / 10 | Neutral
Indicator Scorecard
Indicator | Reading | Score / 10 |
|---|---|---|
RSI (14) | Neutral at midline, no overbought or oversold extremes | 6 |
EMAs (20 / 50 / 100 / 200) | Perfect bullish alignment, price above all four averages | 9 |
Bollinger Bands | Price near middle band, bands compressed and tight | 4.5 |
Fibonacci | Price in golden zone between 0.618 and 0.786 levels | 8 |
Support | Multiple levels nearby, primary at $78.58 | 6.5 |
Resistance | Heavy stacked supply between $83.41 and $88.13 | 3 |
Trendline | Price below ascending trendline at $90.18 | 4 |
MACD | Line below signal, histogram negative, momentum fading | 4 |
On-Balance Volume | Falling trend signals distribution and selling pressure | 3 |
Chart Patterns | No clear pattern identified, neutral structure | 5 |
Cumulative Average | Neutral bias across all indicators | 5.3 |
My Trade: Going neutral on HYPE (consolidation needs a catalyst)
I am taking a neutral stance on Hyperliquid HYPE price at $80.86 because the cumulative score of 5.3 out of 10 reflects genuine conflict between the bullish longer-term structure and weakening near-term momentum. The moving averages suggest the uptrend is intact, yet the MACD has rolled over, on-balance volume is falling, and price is stuck below the ascending trendline. I'm not shorting yet because the support at $78.58 is close enough to provide a tight edge, and I'm not chasing higher because the resistance cluster at $83.41 to $88.13 is too formidable and the volume backdrop is deteriorating. Instead, I'm waiting for price to either break decisively above $88.13 or decisively below $78.58 before committing capital, which should happen within the next 7 days.
My entry zone | $79.50 – $81.50 (if consolidation continues) or breakout above $88.13 or below $78.58 |
My stop loss | $77.75 (below primary support at $78.58, confirms downtrend reversal) |
My target 1 | $83.41: first resistance cluster |
My target 2 | $85.33: second resistance level |
My target 3 | $88.13: trendline resistance and upper band of resistance zone |
Risk : Reward | Contingent on breakout direction; neutrality means equal weighting both scenarios |
Position | Flat / observing / waiting for volatility catalyst |
When I Would Exit
I would exit my neutral stance and turn bullish if Hyperliquid price closes and holds above $88.13 on a daily candle with expanding volume, as this would break above the stacked resistance and signal a fresh breakout toward the swing high of $89.69 and beyond. Conversely, my neutral thesis becomes invalid if price closes and holds below $78.58 on a daily candle, which would confirm that the consolidation has reversed into a downtrend and would likely trigger a test of the $65.92 support. Either of these invalidation points would require me to act decisively, and I would not buy Hyperliquid crypto if the lower support breaks, nor would I sell Hyperliquid crypto if the upper resistance breaks without first reassessing whether the longer-term uptrend remains intact. Is Hyperliquid a good long-term investment? That remains true structurally, but the near-term setup requires one of these two breakouts to unfold before I can allocate new capital with confidence.
Disclaimer: This article is produced for informational and educational purposes only and does not constitute financial or investment advice. Cryptocurrency markets are highly volatile and carry significant risk. Always conduct your own research and consult a qualified financial adviser before making any trading decisions.

Pratik Oswal
An Electronics and Telecommunication Engineer with a strong foundation in analytical and quantitative thinking. I have authored seven books on Mathematics and have been actively involved in trading since 2012. Since 2017, I have been deeply engaged in the crypto ecosystem, gaining extensive experience across digital assets, markets, and emerging blockchain technologies. My background combines technical expertise, mathematical proficiency, and over a decade of hands-on experience in financial markets.
More from PratikNext up

Bitway (BTW) Soars 2,993% in 90 Days to Lead Top 50 Crypto Gainers
BTW is down about 8% after a record near $2.75 on 14 October. What Bitway does, where it trades, why trackers disagree on supply and the 2 November unlock.