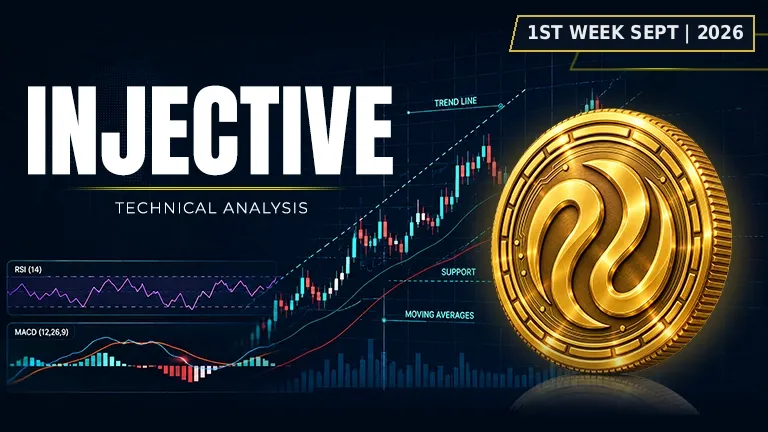
Injective hovers at a crossroads with no clear direction in sight for the coming week.
Asset | INJ (INJ/USDT) |
Price at Analysis | $4.84 |
Timeframe | Daily candle |
Date | September 2, 2026 |
Bias | NEUTRAL |
My Trade | Neutral: waiting for a break |
Cumulative Score | 4.7 / 10 |
200-day EMA | $4.26, price is above |
Bias Invalidation | If price closes above $5.15 with volume, I flip bullish; if it drops below $4.61, I turn bearish |
The Injective INJ price currently sits at $4.84 on September 2, 2026, positioned roughly in the middle of its recent trading range. The Injective crypto price is trading $2.50 below its swing high of $7.34 and $0.88 above its swing low of $3.96, reflecting a consolidation phase after a significant sell-off. The overall market structure suggests neither clear momentum nor immediate capitulation, leaving traders in a state of indecision about the near-term direction.
Across the full suite of technical indicators, the weight of evidence points toward a neutral bias with a cumulative score of 4.7 out of 10. The Injective price appears caught between support and resistance zones, with moving averages stacked in a modest uptrend but momentum indicators showing fading conviction. Volume is rolling over, momentum is diverging from price, and there is no clear chart pattern to guide the next move, suggesting that the next 7 days may require patience rather than aggressive positioning.
RSI: middle ground between buyers and sellers
The Injective INJ price is reflected in an RSI reading of 47.6, sitting just below the 50 midpoint and signaling neither overbought nor oversold conditions. This neutral positioning suggests that momentum is balanced, with neither bulls nor bears firmly in control. A reading this close to 50 typically precedes a move in either direction, but lacks the directional conviction needed to predict which way the break will occur.
Score: 5 / 10 | Neutral
Moving Averages: all uptrend but loss of pace
The INJ price sits above all four key moving averages, with the EMA20 at $4.97, EMA50 at $4.89, EMA100 at $4.74, and the longer-term EMA200 at $4.26 forming a staircase pattern below current price. This alignment traditionally supports a bullish macro structure, but the narrow spread between the 20 and 50-day EMAs suggests the uptrend is stalling. Injective price analysis and chart data reveal that price is only $0.13 above the EMA20, indicating that any pullback could trigger a brief retest of near-term support. For Injective price prediction 2026, this compressed alignment means a bounce or breakdown could arrive quickly once volatility returns.
Score: 5.5 / 10 | Neutral
Bollinger Bands: contracting volatility signals a move coming
The Injective (INJ) to USD exchange rate is positioned between the Bollinger Bands upper level at $5.91 and lower level at $3.85, with the midline at $4.88 sitting just below current price. The bands are relatively narrow compared to the swing range, indicating that volatility is compressed and a breakout in either direction may be imminent. When Bollinger Bands contract this sharply, traders should prepare for expansion, which historically correlates with either a strong push higher or a cascade lower depending on which level breaks first.
Score: 4.5 / 10 | Neutral
Fibonacci Retracements: why is Injective (INJ) price dropping from these levels
Using the swing high of $7.34 and swing low of $3.96, the Injective price currently sits between the 0.236 retracement level at $4.76 and the 0.382 level at $5.25, placing it right at the shallow end of the retracement zone. This proximity to the 23.6% Fib suggests the market has not yet committed to a deeper pullback, but if selling accelerates, the next structural support zone arrives at the 0.382 level. For Injective price prediction 2030, the position of the current price near shallow Fib levels suggests limited downside protection if confidence erodes, though the longer retracement levels at 0.500 ($5.65) and 0.618 ($6.05) offer psychological targets further up the ladder.
Score: 4 / 10 | Bearish
Support Levels: strong foundation beneath current price
Injective has a well-defined support structure at $4.78, $4.61, $4.47, and $4.29, with the first level just $0.06 below the current price at $4.84. This tight clustering of support offers meaningful floor protection if selling develops, but it also means that price has very little room for error before testing multiple levels in rapid succession. The presence of strong support at $4.61 and $4.47 gives traders confidence that a meaningful breakdown is not imminent, which partially explains why the neutral bias dominates over a bearish one.
Score: 7.5 / 10 | Bullish
Resistance: stacked overhead supply caps upside
Above current price, resistance arrives in quick succession at $4.97, $5.15, $5.46, and $5.65, with the first two levels occupying just $0.18 of price space. This tightly stacked overhead supply makes a move to $5.50 or higher a multi-step process that would require sustained buying pressure and likely a break of volume. The sheer concentration of resistance between $4.97 and $5.15 makes this the most critical zone to watch, as a close above $5.15 would signal a genuine shift higher, while a rejection at $4.97 would reinforce the sideways bias.
Score: 3 / 10 | Bearish
Trendline: trading sideways along the mean
The dominant trendline sits at $5.02 with a sideways direction, placing it directly above the current price and acting as a natural pullback target for mean-reversion trading. Price has retreated below this trendline level, which is typical of sideways market behavior where the price oscillates above and below a central reference point. The sideways classification suggests that neither bulls nor bears have established clear control, and a break of this trendline in either direction would likely signal the beginning of the next trending phase.
Score: 5 / 10 | Neutral
MACD: momentum fading as fast as it arrived
The MACD line stands at 0.076590 while the signal line is at 0.110494, with a histogram of -0.033904 indicating that the line is below the signal, a bearish configuration. This recent crossover suggests that momentum peaked recently and is now rolling over, though the lines remain in positive territory. The negative histogram reading warns that if this divergence widens, the case for downside acceleration becomes stronger, but the shallow depth of the negative histogram suggests this momentum loss is still in its early stages.
Score: 4 / 10 | Bearish
On-Balance Volume: falling volume confirms fading interest
On-Balance Volume is in a falling trend, signaling that volume on down days is outpacing volume on up days despite price holding above key support levels. This distribution pattern is a red flag because it shows that bulls are struggling to attract fresh capital to sustain a rally, even as price remains elevated. In isolation, falling OBV would not be decisive, but when combined with the MACD divergence and the compression in the moving averages, it reinforces the neutral-to-bearish bias that says I would not buy Injective crypto at current levels.
Score: 3 / 10 | Bearish
Chart Patterns: no clear signal to guide the next move
There is no clear chart pattern visible in the current INJ price structure, meaning traders cannot rely on measured targets or historical completion statistics to predict the next leg. The absence of a recognizable pattern such as a triangle, flag, or double top leaves price action more ambiguous and increases the value of support and resistance levels as guides. In choppy markets without pattern structure, I would not sell Injective crypto on conviction alone, but would instead wait for either a pattern to form or a support and resistance level to break decisively.
Score: 5 / 10 | Neutral
Indicator | Reading | Score / 10 |
|---|---|---|
RSI (14) | Neutral zone at 47.6, no momentum bias | 5 |
EMAs (20 / 50 / 100 / 200) | Uptrend intact but uptrend stalling | 5.5 |
Bollinger Bands | Volatility compressed, breakout pending | 4.5 |
Fibonacci | Shallow retracement near 0.236 level | 4 |
Support | Strong floor at $4.61 and $4.47 | 7.5 |
Resistance | Stacked supply from $4.97 to $5.15 | 3 |
Trendline | Sideways at $5.02 above price | 5 |
MACD | Line below signal, momentum diverging | 4 |
On-Balance Volume | Falling trend signals distribution weakness | 3 |
Chart Patterns | No clear pattern in structure | 5 |
Cumulative Average | NEUTRAL bias: I'm staying on the sidelines | 4.7 |
I am taking a neutral stance on Injective at this moment because the cumulative score of 4.7 out of 10 reflects genuine indecision across the technical suite. My thesis is that price is currently trapped between support at $4.61 and resistance at $5.15, and until price breaks decisively above or below this zone, I have no conviction to commit capital. I'm holding back because the falling OBV and MACD divergence suggest that any bounce from here faces a mountain of overhead supply, while the tight clustering of support suggests that downside is cushioned in the near term.
My entry zone | $4.78 – $4.84 (on consolidation confirmation) |
My stop loss | $4.29 (break of final support level) |
My target 1 | $5.15: first stacked resistance zone |
My target 2 | $5.46: second resistance level |
My target 3 | $5.65: 0.500 Fibonacci retracement |
Risk : Reward | 1 : 1.8 (T1) / 1 : 4.4 (T3) |
Position | Neutral / awaiting breakout confirmation |
I would exit my neutral stance and flip decisively bullish if price closes above $5.15 with volume, because that level is the gateway above the tightly stacked resistance cluster. Conversely, I would turn decidedly bearish if price drops below $4.61 and closes below the EMA50 at $4.89, signaling that support has failed and a retest of $4.47 or $4.29 is coming. My thesis is wrong if the next move is truly strong and sudden in either direction, meaning I should reassess my position immediately upon a break of either the $5.15 or $4.61 levels rather than waiting for a full candle close. Is Injective a good long-term investment. For that, I would need to see either a sustained daily close above $5.65 or a reversal pattern that gives me confidence in a multi-week bounce.
Disclaimer: This article is produced for informational and educational purposes only and does not constitute financial or investment advice. Cryptocurrency markets are highly volatile and carry significant risk. Always conduct your own research and consult a qualified financial adviser before making any trading decisions.
A popular crypto token is caught between bullish patterns and bearish momentum. Which force wins?
 HYPE
HYPE
Ripple sits frozen between hope and caution as major signals clash over what comes next.
 XRP
XRP
Solana is at a crossroads. The charts are sending mixed signals about which way it breaks.
 SOL
SOL
