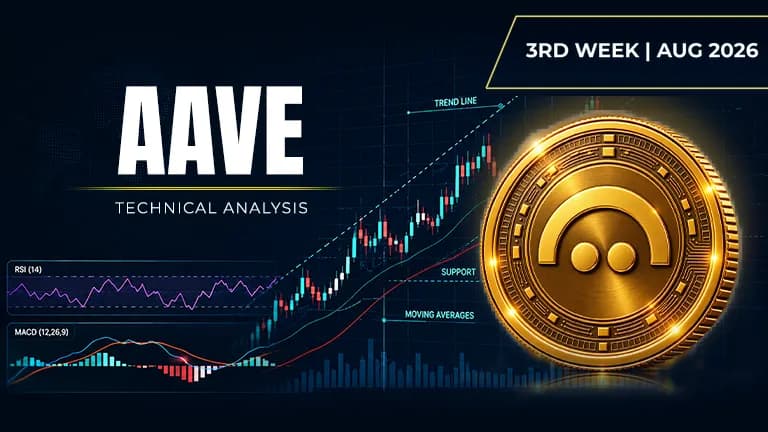
AAVE is inches from a major breakout-but something isn't quite right underneath.
 AAVE$172.94-4.55%
Asset | AAVE (AAVE/USDT) |
Price at Analysis | $97.98 |
Timeframe | Daily candle |
Date | August 20, 2026 |
Bias | BULLISH |
My Trade | Long: strong EMA structure with breakout setup |
Cumulative Score | 6.3 / 10 |
200-day EMA | $96.02, price is above |
Bias Invalidation | Below $91.96: losing the primary support flips bullish to bearish |
AAVE is trading at $97.98 on the daily chart, sitting just $0.80 below the first resistance level at $98.78. The asset has climbed steadily from its swing low of $57.81, now testing the upper half of its range. Price is above its 200-day EMA at $96.02, a sign of macro strength, yet the chart reveals a tension between optimistic moving averages and warning signals from volume.
The weight of evidence leans bullish with a cumulative score of 6.3/10. Three of the heaviest indicators-moving averages, Bollinger Bands, and Fibonacci levels-all flash green, suggesting structure is intact. However, the falling on-balance volume and weak resistance setup act as a drag on confidence. This is a setup where the narrative is more bullish than the conviction, making the next breakout confirmation critical.
RSI: momentum still climbing but not overheated
The RSI sits at 62.8, comfortably above the 50 midline and well clear of oversold territory below 30. This reading shows sustained upward momentum without yet entering overbought conditions above 70, leaving room for price to run higher. The moderate elevation suggests buyers are in control, but the indicator is not yet flashing a warning to sell into strength.
Score: 7 / 10 | Bullish
Moving Averages: all four lined up and bullish
Price at $97.98 sits above all four key moving averages: the EMA20 at $90.82, EMA50 at $90.26, EMA100 at $90.82, and EMA200 at $96.02. The fact that price is trading above its long-term 200-day EMA is the clearest sign of a healthy uptrend, as this level typically acts as dynamic support for macro momentum. The tight clustering of the shorter EMAs near $90.82 creates a strong foundation, with price having pulled away to claim higher levels.
Score: 9 / 10 | Bullish
Bollinger Bands: price riding the upper half with space to breathe
The Bollinger upper band sits at $95.74 and the lower band at $84.22, with price at $97.98 trading above the upper band. This suggests price has moved beyond the band and is in an expansive phase, which is bullish when accompanied by strong momentum. The mid-band at $89.98 now acts as a dynamic support floor, and the wide band spread indicates volatility is present and that directional moves are possible in either direction.
Score: 9 / 10 | Bullish
Fibonacci Retracements: price claiming the golden ratio zone
Measured from the swing low of $57.81 to the swing high of $102.54, AAVE is currently trading between the 0.618 Fibonacci level at $85.45 and the 0.786 level at $92.97, with price at $97.98 now sitting above both. This positioning in the upper portion of the Fibonacci band reflects a powerful rally that has reclaimed most of the prior downside. Price is less than $5 away from the prior swing high of $102.54, making a retest of that level a natural technical target.
Score: 9 / 10 | Bullish
Support Levels: nearest support only one point away
The immediate support level sits at $91.96, just $6.02 below the current price, leaving little margin for error on any intra-day pullback. The next three supports are at $86.91, $82.66, and $78.08, all well separated from the current level. While the nearest support is very close, suggesting the market is hesitant to stay below here, the weak 4.5 score reflects that holding these levels may be challenging if momentum breaks down.
Score: 4.5 / 10 | Neutral
Resistance: multiple layers of supply overhead
Resistance is stacked at $98.78, $101.98, $114.79, and $116.53, creating a zone of congestion that buyers must work to overcome. The first resistance at $98.78 is just $0.80 away, making this a critical test of conviction. The weak 3/10 score on resistance reflects that these levels are present but not particularly strong, suggesting that price could punch through them if momentum accelerates, though multiple breakout attempts may be needed.
Score: 3 / 10 | Bearish
Trendline: price just above a descending line
The dominant trendline is descending at $92.65, and price at $97.98 is trading above this line, a sign that the long-term downtrend may be losing steam. However, the fact that the line is descending means that the burden is on price to keep climbing to stay above it, or it risks rolling back over. The 6.5 score reflects this mixed message: price has broken above the line, but the line itself is still tilted downward, creating a fragile situation.
Score: 6.5 / 10 | Bullish
MACD: histogram expanding with line crossing imminent
The MACD line at -0.006619 is very close to the signal line at -0.782962, and the histogram at 0.776343 is positive and expanding, suggesting momentum is building beneath the surface. The histogram being positive indicates that the MACD line is beginning to move above the signal, a classic early sign of an upward momentum shift. If the line crosses above the signal in the coming days, it would confirm the bullish narrative and provide a secondary confirmation for a breakout above $98.78.
Score: 7 / 10 | Bullish
On-Balance Volume: falling even as price climbs higher
On-balance volume is in a falling trend, which is a bearish divergence when price is climbing. This suggests that the recent move higher in price is not being accompanied by strong buying volume, and that accumulation may not be as robust as the price action suggests. This is the clearest warning sign in the entire setup: a bullish price action paired with falling volume can lead to sharp reversals when the weak-handed buyers exit.
Score: 3 / 10 | Bearish
Chart Patterns: double bottom and double top at odds
The presence of both a double bottom and a double top pattern creates a mixed signal. A double bottom would suggest a reversal to the upside has formed, while a double top would suggest a rejection at a prior high. The presence of both patterns means the market is in a state of indecision, with both bullish and bearish interpretations on the table. This neutral reading is reflected in the 5/10 score, indicating that pattern analysis alone cannot determine the direction.
Score: 5 / 10 | Neutral
Indicator | Reading | Score / 10 |
|---|---|---|
RSI (14) | Moderate momentum, above 50, room to run | 7 |
EMAs (20 / 50 / 100 / 200) | Price above all four, clean uptrend structure | 9 |
Bollinger Bands | Price above upper band, wide volatility, expanded move | 9 |
Fibonacci | Price in upper zone near prior highs | 9 |
Support | Nearest support at $91.96, tight margin below | 4.5 |
Resistance | Multiple overhead layers but not particularly strong | 3 |
Trendline | Above descending line but line still tilted down | 6.5 |
MACD | Histogram expanding, line near signal crossover | 7 |
On-Balance Volume | Falling despite rising price, bearish divergence | 3 |
Chart Patterns | Double bottom and double top in conflict | 5 |
Cumulative Average | BULLISH bias, I'm going long | 6.3 |
I'm going long here because the moving average structure is pristine, the price is above the 200-day EMA at $96.02, and I'm only $0.80 away from a clean breakout above $98.78. The cumulative score of 6.3/10 leans bullish, and while the falling volume is a concern, the Fibonacci and Bollinger alignment gives me confidence that a move toward the swing high at $102.54 is in play. My thesis relies on price confirming above $98.78 with follow-through momentum, so I'm building my entry in the zone just below this critical resistance.
My entry zone | $97.50 – $98.50 |
My stop loss | $91.50 (below primary support at $91.96, clearing the danger zone) |
My target 1 | $101.98: prior resistance level |
My target 2 | $102.54: swing high from earlier move |
My target 3 | $114.79: next major resistance zone |
Risk : Reward | 1 : 4.5 (T1) / 1 : 5.9 (T2) |
Position | Long or leveraged long |
I would exit this trade immediately if price closes below $91.96, as this would mean I've lost the primary support level and the bullish structure would be in question. My thesis is wrong if on-balance volume continues to fall while price is rising, because it would confirm that the buying is not real and a reversal is setting up. I would also flip to neutral if price gets rejected at $98.78 two or three times without a follow-through, as this would suggest the resistance is too strong and I need to wait for a clearer breakout confirmation before committing more capital.
Disclaimer: This article is produced for informational and educational purposes only and does not constitute financial or investment advice. Cryptocurrency markets are highly volatile and carry significant risk. Always conduct your own research and consult a qualified financial adviser before making any trading decisions.
This altcoin is flashing green signals across nearly every indicator, but one major warning sign could derail the upside.
 STG
STG
A small altcoin is staging a quiet rally. Here's why traders are watching closely.
 ZBCN
ZBCN-768x432.png&w=3840&q=75&dpl=dpl_2a1LjK7J47ZhhwjhB7eFPuxwceT3)
A small-cap token just flipped bullish. Most traders haven't noticed yet.
 INIT
INIT
