NEAR Protocol price is quietly setting up for its biggest move in months, and most traders have no idea.
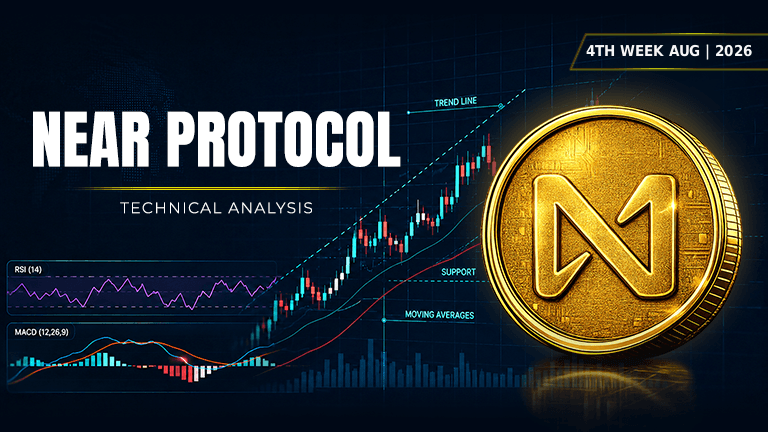
 NEAR$5.03-4.01%
Asset | NEAR (NEAR/USDT) |
Price at Analysis | $1.85 |
Timeframe | Daily candle |
Date | August 31, 2026 |
Bias | BULLISH |
My Trade | Long: strong EMA alignment and rising volume |
Cumulative Score | 6.3 / 10 |
200-day EMA | $1.64, price is above |
Bias Invalidation | Close below $1.75 on daily candle, which breaks primary support zone |
NEAR price is trading at $1.85, sitting comfortably above its 200-day exponential moving average of $1.64. The token is currently between major resistance overhead and a cluster of support levels just beneath current price. We are roughly 40% below the swing high of $3.09 established earlier in the move, meaning there is structural room to run if momentum accelerates. The overall market structure feels consolidative but constructive.
The weight of evidence across all ten indicators leans bullish with a cumulative score of 6.3 out of 10. NEAR Protocol price is showing strong alignment in the moving average stack, rising on-balance volume that confirms accumulation, and MACD momentum that is positive and building. The primary headwind is resistance sitting immediately overhead and Fibonacci levels that suggest the market needs to prove itself before a sustained rally. For NEAR Protocol, the next seven days will tell us whether this double bottom pattern evolves into a genuine breakout or just noise in a choppy range.
RSI: Neutral momentum in the transition zone
The Relative Strength Index is at 53.1, which places it in the neutral zone between oversold and overbought territory. This reading suggests neither extreme buying pressure nor exhaustion, but rather a market in transition that could tip either direction with the right catalyst. Since RSI is above 50, there is a slight lean toward positive momentum, though the reading is not yet stretched enough to signal imminent pullback risk.
Score: 6 / 10 | Bullish
Moving Averages: All stacked in bullish alignment
The exponential moving average structure is extremely encouraging. The 20-day EMA sits at $1.81, the 50-day at $1.81, and the 100-day at $1.79, meaning all three shorter-term averages are stacked in bullish order and hugging the current price tightly. The 200-day EMA of $1.64 provides a macrotrend anchor well below current levels, confirming that NEAR price is trading above the long-term moving average. This alignment is textbook bullish and suggests that both short-term traders and longer-term holders are in agreement on direction.
Score: 9 / 10 | Bullish
Bollinger Bands: Volatility contracting into opportunity
The Bollinger Bands show an upper band at $2.06, a midline at $1.79, and a lower band at $1.52. Current NEAR price of $1.85 is positioned just above the midline, indicating that the bands have contracted inward and volatility is being compressed. When bands are this tight relative to recent price action, it often precedes a directional breakout, and the proximity to the upper band suggests bullish intent should momentum ignite.
Score: 6 / 10 | Bullish
Fibonacci Retracements: Overhead resistance zone is formidable
Using the swing high of $3.09 and swing low of $1.54, the Fibonacci retracement levels reveal that NEAR price is currently sitting below the 0.236 level at $1.90. Above that lie the 0.382 at $2.13, the 0.500 at $2.31, and progressively higher levels at $2.49 and $2.75. These Fibonacci zones represent mathematically significant resistance clusters, and price would need to clear several of them sequentially to reach higher targets.
Score: 3 / 10 | Bearish
Support Levels: Strong foundation just below current price
The primary support cluster sits at $1.83, just $0.02 beneath the current price, followed by $1.78, $1.75, and $1.72 in descending order. This tiered support structure creates a safety net that limits downside risk in the near term and provides multiple levels where buyers are likely to defend. The proximity of these levels to current price suggests the market has already established a foundation and is in no rush to revisit much lower zones.
Score: 7.5 / 10 | Bullish
Resistance: Multiple layers overhead create friction
Resistance begins immediately at $1.86, just one cent above current price, with additional layers at $1.96, $2.06, and $2.11. This stacked overhead supply is the primary reason why NEAR Protocol price cannot simply rocket higher without proving itself through resistance clearing. The concentration of these levels suggests this is a key area where sellers have repeatedly stepped in, and breaking through will require volume and conviction.
Score: 3 / 10 | Bearish
Trendline: Price hovering just above the descending line
The dominant trendline is descending and sits at $1.80, which means NEAR price is currently trading $0.05 above this line. The fact that price is holding above the trendline is mildly constructive, as it suggests a break in the downtrend, but the line itself remains a potential test if momentum falters. Should price fall back toward $1.80, the trendline would offer a natural pivot point to watch for buyer support.
Score: 6.5 / 10 | Bullish
MACD: Bullish crossover establishing positive momentum
The MACD line is at 0.038108 and the signal line is at 0.033213, with a histogram of 0.004895, which means the line is above the signal and the histogram is positive. This configuration indicates that momentum is accelerating in the bullish direction, though the absolute magnitude of the histogram shows this is still in its early phase. The reading suggests buyers are gaining control, but more volume and follow-through are needed to confirm a sustained advance.
Score: 8.5 / 10 | Bullish
On-Balance Volume: Accumulation is outpacing selling
The on-balance volume trend is rising, which means that on aggregate, buying volume is exceeding selling volume and accumulation is in progress. This is a critical confirmation that the price movement we are seeing is backed by genuine interest from buyers, not just a mechanical bounce. Rising OBV provides conviction that NEAR Protocol price has real support underneath it and this is not a hollow rally.
Score: 7 / 10 | Bullish
Chart Patterns: Double bottom suggests reversal potential
The double bottom pattern that has formed indicates that NEAR has tested a support level twice without breaking through, which is historically a bullish reversal signal. A double bottom measured move would suggest an upside target roughly equal to the height of the pattern added to the neckline, which would project toward the Fibonacci resistance zones outlined above. The pattern is constructive, but the breakout must be confirmed with volume and price closure above $1.86 to validate the setup.
Score: 6.5 / 10 | Bullish
Indicator | Reading | Score / 10 |
|---|---|---|
RSI (14) | Neutral zone, slight bullish lean above 50 | 6 |
EMAs (20 / 50 / 100 / 200) | All bullishly aligned, price above all key moving averages | 9 |
Bollinger Bands | Volatility compressed, price above midline | 6 |
Fibonacci | Multiple resistance layers overhead limit near-term upside | 3 |
Support | Strong tiered support cluster just beneath current price | 7.5 |
Resistance | Heavy overhead supply concentrated between $1.86 and $2.11 | 3 |
Trendline | Price above descending line, slight constructive signal | 6.5 |
MACD | Bullish line above signal with positive histogram | 8.5 |
On-Balance Volume | Rising OBV confirms accumulation and buying pressure | 7 |
Chart Patterns | Double bottom pattern suggests reversal potential | 6.5 |
Cumulative Average | BULLISH bias, I'm going long | 6.3 |
I'm going long here because the cumulative score of 6.3 out of 10 combined with the bullish moving average stack, rising on-balance volume, and positive MACD gives me enough conviction to bet on a breakout through the overhead resistance zone. NEAR Protocol price is sitting on a double bottom pattern at exactly the moment when the technical setup is aligned, and I see more risk above current price than below. The support levels at $1.83, $1.78, and $1.75 give me defined risk, and the resistance levels above give me defined targets to scale into.
My entry zone | $1.83 – $1.86 |
My stop loss | $1.74 (break of primary support cluster and invalidation of double bottom) |
My target 1 | $1.96: first resistance level |
My target 2 | $2.11: upper resistance cluster |
My target 3 | $2.31: Fibonacci 0.500 level |
Risk : Reward | 1 : 1.5 (T1) / 1 : 3.2 (T2) |
Position | Long |
I would exit or flip my thesis if NEAR price closes below $1.75 on a daily candle, which would break the primary support zone and invalidate the double bottom pattern entirely. If that happens, I would consider the reversal hypothesis dead and would reverse to a short position targeting the swing low of $1.54. Additionally, if price rallies to $2.11 and fails to hold above that level on the close, I would lighten my position because it would suggest that overhead resistance is stronger than I anticipated and a pullback to retest $1.83 is likely.
Disclaimer: This article is produced for informational and educational purposes only and does not constitute financial or investment advice. Cryptocurrency markets are highly volatile and carry significant risk. Always conduct your own research and consult a qualified financial adviser before making any trading decisions.
This altcoin is flashing green signals across nearly every indicator, but one major warning sign could derail the upside.
 STG
STG
A small altcoin is staging a quiet rally. Here's why traders are watching closely.
 ZBCN
ZBCN-768x432.png&w=3840&q=75&dpl=dpl_2a1LjK7J47ZhhwjhB7eFPuxwceT3)
A small-cap token just flipped bullish. Most traders haven't noticed yet.
 INIT
INIT
