Why WLFI is stuck in no-man's-land right now. What breaks the deadlock?
 WLFI$0.054306-4.31%
Asset | WLFI (WLFI/USDT) |
Price at Analysis | $0.06 |
Timeframe | Daily candle |
Date | August 24, 2026 |
Bias | NEUTRAL |
My Trade | Neutral: waiting for clearer conviction |
Cumulative Score | 5.1 / 10 |
200-day EMA | $0.07, price is below |
Bias Invalidation | Above $0.07 on a daily close flips bias bullish; below $0.05 on a daily close flips bias bearish |
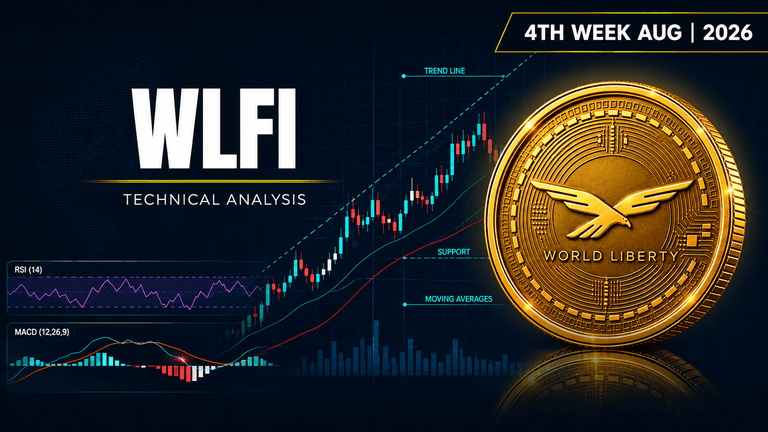
WLFI is trading at $0.06, sandwiched between a swing high of $0.07 and a swing low of $0.05. The price sits exactly at its 20, 50, and 100-day moving averages, which is a rare alignment that speaks to indecision rather than strength. We are trading below the 200-day EMA of $0.07, which is a red flag for the long-term trend, even though we have not broken down below the $0.05 floor yet.
The technical picture is genuinely split. MACD is showing the strongest bullish signal with a score of 8.5, with the MACD line above the signal line and momentum ticking higher. However, this is directly contradicted by falling On-Balance Volume, which suggests that despite price holding steady, buyers are actually retreating behind the scenes. Resistance is stacked at $0.06 and $0.07, making upside breakouts difficult, while support at $0.05 remains intact but not inspiring. The cumulative score of 5.1 out of 10 is a dead tie, and that is exactly what the chart is telling us: we are in neutral territory waiting for conviction.
RSI: Balanced but not compelling
The RSI is sitting at 54.7, which is the definition of neutral territory, hovering just above the 50 midpoint. This reading tells us there is neither buying pressure nor selling pressure dominating the market right now. At this level, RSI is not printing any warning signals of overbought or oversold conditions, which means momentum is stable but directionless.
Score: 6 / 10 | Bullish
Moving Averages: A perfect stalemate setup
All three medium-term moving averages (EMA 20, 50, and 100) are converged at $0.06, exactly where price is trading. This convergence is unusual and signals a moment of true indecision in the market. However, the 200-day EMA sits higher at $0.07, meaning price is trading below the long-term average, which is a subtle bearish signal that the broader trend has not turned bullish yet.
Score: 5.5 / 10 | Neutral
Bollinger Bands: Squeezed and waiting
The Bollinger Bands show an upper band at $0.06, a mid-band at $0.06, and a lower band at $0.05, which indicates low volatility and a compressed trading range. Price is sitting right at the upper band, suggesting we are at a resistance zone within this tight range. When bands are this tight, it often precedes a breakout, so this squeeze setup favors whichever direction breaks first.
Score: 6 / 10 | Bullish
Fibonacci Retracements: Clustered resistance above
The swing from the low at $0.05 to the high at $0.07 gives us our Fibonacci structure. Price at $0.06 sits between the 0.382 and 0.500 Fibonacci levels, both at $0.06, meaning we are trading through a mathematically significant zone. The heavier resistance is clustered at the 0.618 and 0.786 levels, both at $0.07, which forms a secondary ceiling that will need to be cracked for an upside move to gain traction.
Score: 4 / 10 | Bearish
Support Levels: Foundation is holding
Support sits at $0.06 (our current price), with a second tier at $0.05 that appears three times in the support list, indicating it is a strong psychological and technical floor. The $0.05 level has clearly been tested and defended multiple times, which gives it credibility as a real support zone. From our current price of $0.06, we have one cent of room before hitting this strong support, which is tight but not panic-inducing.
Score: 5.5 / 10 | Neutral
Resistance: Overhead supply is dense
Resistance is heavily stacked at $0.06 (our current level) and $0.07, with the $0.07 level appearing twice. This means price faces substantial selling pressure immediately above us, and breaking above $0.07 will be the critical test for any bullish move. The density of resistance at and above the current price is one of the main reasons I am not leaning bullish here, despite some positive momentum signals.
Score: 3 / 10 | Bearish
Trendline: Ascending but weak
The trendline is marked as ascending and running through $0.06, which is exactly where price is trading right now. While an ascending trendline is technically bullish, the fact that we are sitting on it rather than well above it suggests the bull case is fragile. If price closes below $0.06, we would be testing the integrity of this trendline support.
Score: 4 / 10 | Bearish
MACD: The strongest bullish signal on the chart
MACD is the hero of this analysis, with the line at 0.001204 above the signal line at 0.000905, creating a positive histogram of 0.000300. This tells me that momentum is in an uptrend, even if price is not moving dramatically. MACD is the only indicator giving me real confidence in continued buying pressure, which is why it scored 8.5 out of 10 and is my only strong bullish read here.
Score: 8.5 / 10 | Bullish
On-Balance Volume: Buyers are quietly exiting
OBV is trending lower, which is the most damning data point on this chart. Falling volume while price holds steady is a classic sign of weak hands leaving the market, even if price has not rolled over yet. This divergence between price stability and volume decline is why I cannot trust the bullish MACD signal by itself, as OBV suggests distribution is happening beneath the surface.
Score: 3 / 10 | Bearish
Chart Patterns: No clear setup yet
There is no clear pattern visible on the daily chart, which means price is still in formation and has not committed to any directional breakout structure. Without a defined pattern like a cup and handle, head and shoulders, or triangle, I have no measured target to anchor my risk-reward calculation. The lack of pattern clarity is another reason to remain neutral until price prints a more decisive structure.
Score: 5 / 10 | Neutral
Indicator | Reading | Score / 10 |
|---|---|---|
RSI (14) | Neutral at 54.7, no overbought or oversold | 6 |
EMAs (20 / 50 / 100 / 200) | Convergence at $0.06, price below 200 EMA | 5.5 |
Bollinger Bands | Squeezed range, price at upper band | 6 |
Fibonacci | Resistance clustered at 0.618 and 0.786 levels | 4 |
Support | Strong foundation at $0.05, price holding above | 5.5 |
Resistance | Dense overhead supply at $0.06 and $0.07 | 3 |
Trendline | Ascending but sitting on the line itself | 4 |
MACD | Line above signal, positive histogram, strongest bullish read | 8.5 |
On-Balance Volume | Falling despite price stability, bearish divergence | 3 |
Chart Patterns | No clear pattern, price in formation mode | 5 |
Cumulative Average | NEUTRAL bias, evidence is split | 5.1 |
I am sitting on the sidelines here because the market is telling me conflicting stories, and my cumulative score of 5.1 out of 10 is screaming indecision. MACD is bullish, but OBV is rolling over, which means I cannot trust a long entry with conviction. I would wait for price to either close and hold above $0.07, confirming an upside breakout, or drop and hold below $0.05, giving me a clear short opportunity. Right now, at $0.06, I am caught in the middle, and that is not a place I want to risk my capital.
My entry zone | Waiting for breakout: above $0.07 or below $0.05 |
My stop loss | $0.08 if long (stop above resistance cluster), or $0.04 if short (stop below support floor) |
My target 1 | $0.07: resistance zone and Fibonacci 0.618 |
My target 2 | $0.08: next structural resistance above the cluster |
My target 3 | $0.05: support floor if thesis flips bearish |
Risk : Reward | Not applicable while neutral |
Position | Waiting for breakout confirmation before committing |
I would flip bullish and take a long entry if price closes and holds above $0.07 on a daily basis, as that would break the overhead resistance and confirm the MACD momentum signal is real. Conversely, I would go short and bet on downside if price closes and holds below $0.05, invalidating the support floor and signaling that OBV weakness is leading to capitulation selling. My thesis is wrong if MACD continues higher but price refuses to test either $0.07 or $0.05 for more than a few days, in which case the squeeze would likely resolve sideways and I would reassess. Right now, I need to see price print a breakout candle with volume confirmation before I commit capital in either direction.
Disclaimer: This article is produced for informational and educational purposes only and does not constitute financial or investment advice. Cryptocurrency markets are highly volatile and carry significant risk. Always conduct your own research and consult a qualified financial adviser before making any trading decisions.
This altcoin is flashing green signals across nearly every indicator, but one major warning sign could derail the upside.
 STG
STG
A small altcoin is staging a quiet rally. Here's why traders are watching closely.
 ZBCN
ZBCN-768x432.png&w=3840&q=75&dpl=dpl_2a1LjK7J47ZhhwjhB7eFPuxwceT3)
A small-cap token just flipped bullish. Most traders haven't noticed yet.
 INIT
INIT
