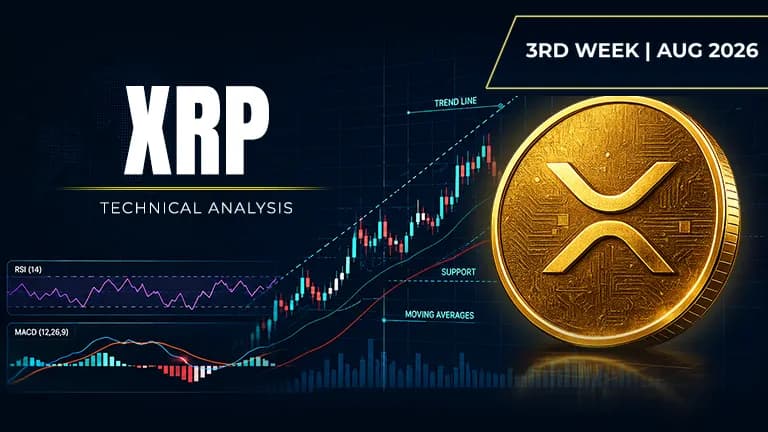
XRP sits at a crossroads where momentum is building but resistance looms dangerously close.
 XRP$1.51+1.51%
Asset | XRP (XRP/USDT) |
Price at Analysis | $1.10 |
Timeframe | Daily candle |
Date | August 20, 2026 |
Bias | BULLISH |
My Trade | Long: rising volume plus momentum |
Cumulative Score | 5.8 / 10 |
200-day EMA | $1.28, price is below |
Bias Invalidation | Below $1.01 on close, thesis is broken |
XRP is trading at $1.10, sitting modestly below its 200-day moving average of $1.28 but firmly above its swing low of $0.99. The coin is trading within its Bollinger Bands and has pulled back from its recent swing high of $1.55. Price remains in the lower half of the daily range, which tells us there is room to the upside, but also that we are not yet in a confirmed bullish structure.
The weight of evidence leans bullish, with momentum indicators and volume showing accumulation, but multiple resistance levels overhead and a bearish Fibonacci setup are acting as headwinds. Seven out of ten indicators are either bullish or neutral, while the 200-day EMA far above price signals that the longer-term trend remains in question. This is a coin caught between a rising short-term impulse and a struggling intermediate structure.
RSI: Climbing into confident territory
The RSI sits at 60.1, which puts it well above the neutral 50 line and into the confident zone without yet hitting overbought extremes above 70. This reading tells me that buyers have momentum on their side and that the move off the lows is attracting fresh interest. An RSI at 60 typically signals that the upside impulse still has room to run before exhaustion becomes a concern.
Score: 7 / 10 | Bullish
Moving Averages: Misaligned and conflicted
The exponential moving averages present a mixed picture. The EMA20 at $1.04 and EMA50 at $1.08 are both below the current price of $1.10, which is bullish structure in the short term. However, the EMA100 at $1.14 and especially the EMA200 at $1.28 are stacked above price, acting as a ceiling. This alignment tells me that while the daily trend is positive, the longer-term structure remains bearish, and price has not yet reclaimed the intermediate moving averages that matter most for conviction.
Score: 5.5 / 10 | Neutral
Bollinger Bands: Price hugging the midline
The Bollinger Bands are set with the upper band at $1.11, the midline at $1.04, and the lower band at $0.97. Price at $1.10 is touching the upper band, which signals that volatility is slightly elevated and buyers are pushing the envelope. However, price is not extended beyond the band, so we are not in an extreme overbought condition. This setup suggests that a breakout above $1.11 could accelerate momentum, while a close back inside the bands would suggest consolidation.
Score: 7.5 / 10 | Bullish
Fibonacci Retracements: Weak structural position
Using the swing high of $1.55 and swing low of $0.99, the Fibonacci levels show that price at $1.10 is sitting between the 0.236 level at $1.12 and the 0.382 level at $1.20. This is a shallow retracement zone, meaning XRP has given back very little of its prior move down. From a structural perspective, being this close to the swing low and so far from the swing high suggests that the correction is incomplete and that there is far more downside available than upside. This is the primary bearish signal in today's chart.
Score: 3 / 10 | Bearish
Support Levels: Multiple cushions below
Support is well-defined at $1.08, $1.05, $1.01, and the swing low of $0.99. The first support at $1.08 is only $0.02 away from the current price, offering a tight stop zone for any pullback. The cluster of supports between $1.01 and $1.08 provides confidence that a breakdown does not happen in a vacuum, and buyers have multiple levels to defend. The proximity of the first support to price makes this an attractive risk management zone for any long position.
Score: 6.5 / 10 | Bullish
Resistance: Stacked and intimidating
Resistance is heavy overhead at $1.12, $1.16, $1.19, and $1.29. The first resistance at $1.12 is only $0.02 above the current price, meaning price is essentially at the doorstep of the first hurdle. The subsequent resistances are tightly spaced, which tells me that any breakout above $1.12 will immediately encounter new overhead supply at $1.16 and $1.19. The psychological resistance at $1.29 aligns with the EMA100, making it a major inflection point. This tight, stacked resistance is the primary reason to be cautious about chasing this bounce.
Score: 3 / 10 | Bearish
Trendline: Descending but price is above
The dominant trendline is descending and is currently set at $1.03. Price at $1.10 is above this line, which is bullish in the short term and shows that the decline has at least temporarily been interrupted. However, the fact that the trendline is descending at all tells me that the intermediate structure is still lower-high, lower-low in nature. A close below $1.03 would break this short-term support and suggest a retest of the swing low.
Score: 6.5 / 10 | Bullish
MACD: Momentum inflecting upward
The MACD line at -0.008785 is currently sitting just above the signal line at -0.018866, with a positive histogram of 0.010081. This reading tells me that momentum is starting to shift from negative to positive, with the line about to cross above the signal line. While both values are near zero, the direction of the histogram is bullish and suggests that the next candles could see a proper bullish crossover. This is an early signal that buyers are taking control, but it is not yet confirmed.
Score: 7 / 10 | Bullish
On-Balance Volume: Accumulation signal
The OBV trend is rising, which is one of the strongest signals in today's analysis. This tells me that volume is flowing into XRP on up days more than it is flowing out on down days, a classic accumulation pattern. Rising OBV combined with an RSI above 50 and a price above the short-term moving averages creates a bullish confluence that suggests institutional or smart money is accumulating. This is the kind of volume pattern that often precedes a sustained rally.
Score: 7 / 10 | Bullish
Chart Patterns: Mixed signals from structure
The chart is showing both a double bottom and a double top, which is contradictory at first glance. The double bottom would be bullish and suggest a reversal from the lows, while the double top would be bearish and suggest a ceiling has formed. The presence of both patterns simultaneously suggests that price is stuck in consolidation and that the pattern is not yet resolved. Neither pattern has confirmed, so we cannot draw a strong directional conclusion from the chart structure alone.
Score: 5 / 10 | Neutral
Indicator | Reading | Score / 10 |
|---|---|---|
RSI (14) | At 60, buying momentum is present | 7 |
EMAs (20 / 50 / 100 / 200) | Short-term bullish, long-term bearish | 5.5 |
Bollinger Bands | Price at upper band, room to $1.11 | 7.5 |
Fibonacci | Shallow retracement, incomplete correction | 3 |
Support | Four levels stacked between $1.08 and $0.99 | 6.5 |
Resistance | Heavy at $1.12, $1.16, $1.19, $1.29 | 3 |
Trendline | Price above descending line at $1.03 | 6.5 |
MACD | Line crossing above signal, momentum turning | 7 |
On-Balance Volume | Rising trend confirms accumulation | 7 |
Chart Patterns | Double bottom and double top unresolved | 5 |
Cumulative Average | BULLISH bias, I am going long | 5.8 |
I am going long here because the cumulative score of 5.8 out of 10 leans bullish, and I see a clear confluence of rising volume, improving momentum, and tight support below. My entry is anchored to the current price zone where I can see RSI confirming, OBV accumulating, and the MACD about to cross bullish. I am not chasing aggressively, but I am willing to participate in this bounce because the risk-to-reward is defined and the downside protection is strong.
My entry zone | $1.08 – $1.10 |
My stop loss | $1.01 (below the support cluster) |
My target 1 | $1.16: second resistance level |
My target 2 | $1.20: Fibonacci 0.382 retracement |
My target 3 | $1.29: EMA100 and fourth resistance |
Risk : Reward | 1 : 1.5 (T1) / 1 : 2.75 (T2) |
Position | Long |
I would exit or flip to short if price closes below $1.01 on the daily timeframe. This level is the bottom of my support cluster, and a break below it would invalidate the bullish bias and signal that the swing low is in danger of being retested. I would also watch for a failure to break above $1.12 on the third attempt. If price repeatedly bounces off $1.12 and then reverses with declining OBV, I would exit my long and reassess the structure. My thesis depends on momentum carrying through resistance, and if that fails, the Fibonacci setup and the 200-day EMA overhead become the dominant narrative again.
Disclaimer: This article is produced for informational and educational purposes only and does not constitute financial or investment advice. Cryptocurrency markets are highly volatile and carry significant risk. Always conduct your own research and consult a qualified financial adviser before making any trading decisions.
This crypto just flashed all the right signals. Is this your entry point?
 NEAR
NEAR
A small altcoin is showing all the signs of a major breakout. Here's what the numbers say.
This oracle token is breaking higher. Should you buy in before the next move?
 LINK
LINK
