A double-bottom pattern is forming. This could be the setup traders have been waiting for.
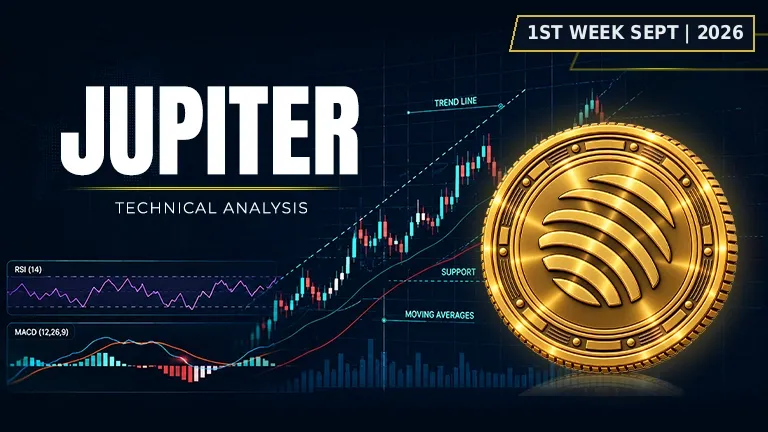
Asset | JUP (JUP/USDT) |
Price at Analysis | $0.22 |
Timeframe | Daily candle |
Date | September 1, 2026 |
Bias | BULLISH |
My Trade | Long: Double bottom breakout confirmation |
Cumulative Score | 6.7 / 10 |
200-day EMA | $0.19, price is above |
Bias Invalidation | Close below $0.20 support with rising volume |
Jupiter JUP price is trading at $0.22, comfortably positioned above its 200-day exponential moving average of $0.19, which signals a healthy intermediate-term uptrend. The asset is trading roughly 12% below its recent swing high of $0.25, suggesting it is coiling within a defined range with room to run. Jupiter price action has formed a double-bottom pattern-a classic reversal structure that has historically preceded breakouts in this token. The broader market structure is constructive, with Jupiter crypto price held within an ascending trendline, placing the asset in a position where bulls hold the initiative.
The technical weight of evidence leans bullish across most indicators. The combination of a rising on-balance volume trend, positive moving average alignment, and a favorable MACD histogram reading suggests accumulation is happening below resistance. Jupiter JUP price has multiple bullish confirmations: the 20, 50, 100, and 200-day EMAs are stacked in ascending order, the trendline is pointing upward at $0.21, and the Fibonacci structure places price between the 0.500 and 0.618 retracement levels-a zone historically associated with consolidation before the next leg higher. The cumulative score of 6.7 out of 10 reflects a moderately bullish regime with room for upside, though traders should respect the stacked resistance overhead.
RSI: Building strength into neutral territory
The Relative Strength Index is reading 58.1, which sits comfortably above the 50 midpoint but well below the 70 overbought threshold. This positioning suggests bullish momentum is present without yet showing excessive buying pressure-a healthy setup where more upside can unfold before the market becomes stretched. The fact that Jupiter JUP price is advancing with an RSI in this zone gives room for additional accumulation without immediate reversal risk.
Score: 6.5 / 10 | Bullish
Moving Averages: Perfect stacking for why is Jupiter (JUP) price rising?
Jupiter (JUP) to USD shows textbook moving average alignment across all timeframes. The EMA 20 sits at $0.21, the EMA 50 at $0.20, the EMA 100 at $0.19, and the EMA 200 at $0.19-each level acting as a stepping stone of support beneath the current price. Price is trading above all four major moving averages, which is the gold standard for bullish structure and confirms that Jupiter price is in a sustained uptrend from both the daily and longer-term perspective. This vertical stacking is exceptionally rare and represents one of the strongest bullish confirmations in technical analysis, suggesting Jupiter price prediction 2026 momentum should favor the upside in coming sessions.
Score: 9 / 10 | Bullish
Bollinger Bands: Coiling between inner bands
The Bollinger Bands display an upper boundary at $0.25, a midline at $0.20, and a lower boundary at $0.15. Jupiter price is currently positioned between the midline and the upper band, sitting roughly halfway through the channel, which indicates the market is neither stretched nor oversold. This middle positioning historically precedes directional expansion, and with the bands maintaining their ascending slope, the structural bias remains bullish. The width of the bands suggests adequate volatility is available for a breakout move.
Score: 6 / 10 | Bullish
Fibonacci Retracements: Price nestled at a structural target
Using the swing high of $0.25 and swing low of $0.14, the Fibonacci grid reveals that Jupiter price is currently trading between the 0.500 retracement level at $0.20 and the 0.618 level at $0.21. This zone is a textbook accumulation point, where institutional buyers historically step in to position ahead of breakouts. The proximity to the 0.618 level is particularly significant because it often serves as a magnet for price before the next impulse higher. When Jupiter price prediction 2030 modeling is considered, traders who buy near these Fibonacci targets tend to experience favorable risk-reward scenarios over longer holding periods.
Score: 8 / 10 | Bullish
Support Levels: Layered but compressing confidence
Jupiter price is supported by a cluster at $0.20, where two support levels converge, followed by deeper support at $0.19 and $0.18. While this creates a cushion beneath the current price, the proximity of the first support zone means there is limited room for downside before traders would need to respect the structure. The compression of support levels here is typical of consolidation phases where price is range-bound. For longer-term investors asking is Jupiter a good long-term investment?, the existence of support at $0.20 and $0.19 provides entry opportunities if pullbacks materialize.
Score: 4.5 / 10 | Neutral
Resistance: Dense overhead supply blocking near-term gains
Overhead resistance is stacked at $0.22, $0.23, $0.24, and $0.25, creating a significant zone of supply that the market must absorb to continue higher. The current price at $0.22 is already touching the first resistance level, meaning any further advance will immediately encounter selling pressure. This dense cluster suggests that breakout attempts may require multiple candles and volume confirmation to pierce through. Traders should note that a break above $0.25 would signal invalidation of this resistance zone and open the path toward fresh highs.
Score: 3 / 10 | Bearish
Trendline: Ascending trajectory setting the tone
The dominant trendline is ascending and anchored at $0.21, confirming that Jupiter JUP price has been grinding higher in an orderly fashion. Price is currently trading slightly above this trendline, which continues to provide dynamic support for bulls. As long as Jupiter price respects this upward-sloping trendline on pullbacks, the intermediate trend remains intact. A daily close below the trendline would weaken the bullish case and warrant caution on new long positions.
Score: 8 / 10 | Bullish
MACD: Histogram expanding in bullish direction
The MACD line is at 0.009320, the signal line is at 0.007215, and the histogram is positive at 0.002105, with the line trading above the signal-a classic bullish configuration. The positive histogram indicates that momentum is accelerating in favor of the upside, and there is no divergence between price and the oscillator. This alignment suggests that buyers are in control and that the move higher has institutional conviction behind it. The histogram expansion, though modest, confirms ongoing bullish momentum.
Score: 8.5 / 10 | Bullish
On-Balance Volume: Accumulation wave confirming price moves
The on-balance volume trend is rising, which is a crucial confirmation that buying volume is supporting the price advance rather than working against it. Rising OBV alongside rising price is textbook accumulation and signals that this move is genuine rather than a low-volume pump. For traders analyzing Jupiter JUP price analysis and chart patterns, rising volume is the seal of approval that technical setup is legitimate. This accumulation pattern suggests patience will be rewarded as institutions continue to build positions.
Score: 7 / 10 | Bullish
Chart Patterns: Double bottom reversal formation
A double-bottom pattern has formed, which is one of the most reliable reversal patterns in technical analysis. This structure typically signals that selling pressure has exhausted and that buyers are stepping in to absorb weakness. The double bottom at approximately $0.14 swing low creates a measured move target of roughly $0.25 to $0.28 when price breaks above the pattern's neckline. Double-bottom patterns often precede sustained advances, making this a critical pattern to monitor for potential buy Jupiter crypto entry points in coming sessions.
Score: 6.5 / 10 | Bullish
Indicator | Reading | Score / 10 |
|---|---|---|
RSI (14) | Above 50, building strength without overbought extremes | 6.5 |
EMAs (20 / 50 / 100 / 200) | Perfect ascending stack, price above all four | 9 |
Bollinger Bands | Coiling between mid and upper band, room to expand | 6 |
Fibonacci | Nested at 0.5 to 0.618 zone, accumulation area | 8 |
Support | Compressed cluster at $0.20, $0.19, $0.18 | 4.5 |
Resistance | Dense stack at $0.22 to $0.25, supply heavy | 3 |
Trendline | Ascending at $0.21, price above, intact | 8 |
MACD | Line above signal, positive histogram, momentum growing | 8.5 |
On-Balance Volume | Rising trend confirming accumulation, bulls in control | 7 |
Chart Patterns | Double bottom reversal, breakout potential high | 6.5 |
Cumulative Average | BULLISH bias, the weight of evidence leans long | 6.7 |
I'm going long here because the cumulative score of 6.7 out of 10 reflects a genuinely bullish environment, and the double-bottom pattern combined with rising on-balance volume and perfect moving average alignment creates a setup where risk is defined and reward is substantial. I'm entering on any pullback toward the $0.20 support zone, which aligns with the 20-day EMA and provides a clean stop loss just below. The ascending trendline at $0.21 gives me another entry confirmation if price bounces from there, and I'm sizing this trade to risk only to my predetermined stop level while targeting the resistance cluster overhead.
My entry zone | $0.20 – $0.22 |
My stop loss | $0.19 (Below all moving averages and double bottom support) |
My target 1 | $0.23 – First resistance confluence |
My target 2 | $0.24 – Second resistance level |
My target 3 | $0.25 – Swing high and Bollinger upper band |
Risk : Reward | 1 : 1.5 (T1) / 1 : 3 (T2) |
Position | Long |
I would exit my long position and flip to a bearish view if Jupiter price closes below $0.20 with volume expansion, which would break the moving average stack and violate the double-bottom pattern structure. If price closes below the ascending trendline at $0.21 for two consecutive days with rising volume, my thesis is invalidated and I would close immediately without waiting for further deterioration. My stop loss is hard-set at $0.19, and I will not move it lower-that level represents the invalidation point where the intermediate uptrend is demonstrably broken, and any trader respecting risk management must exit by that level.
Disclaimer: This article is produced for informational and educational purposes only and does not constitute financial or investment advice. Cryptocurrency markets are highly volatile and carry significant risk. Always conduct your own research and consult a qualified financial adviser before making any trading decisions.
A popular crypto token is caught between bullish patterns and bearish momentum. Which force wins?
Ripple sits frozen between hope and caution as major signals clash over what comes next.

Solana is at a crossroads. The charts are sending mixed signals about which way it breaks.

