This altcoin is climbing hard, but one level could stop it cold.
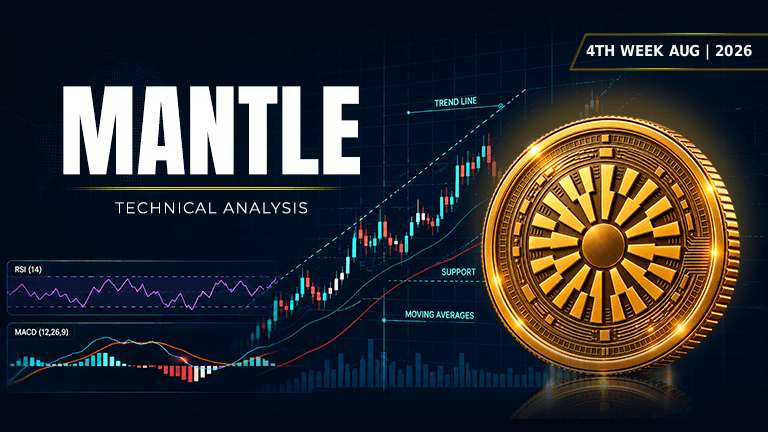
 MNT$0.579181-9.84%
Asset | MNT (MNT/USDT) |
Price at Analysis | $0.57 |
Timeframe | Daily candle |
Date | August 31, 2026 |
Bias | BULLISH |
My Trade | Long: strong momentum and support confluence |
Cumulative Score | 7 / 10 |
200-day EMA | $0.58, price is below |
Bias Invalidation | Break below $0.49 on daily close would flip my thesis to neutral |
Mantle is trading at $0.57 as of August 31, 2026, sitting just below the 200-day exponential moving average of $0.58. The token is trading roughly 19% below its recent swing high of $0.70, putting it in a meaningful pullback zone that has attracted fresh buying interest. The overall market structure remains elevated, suggesting that even as the short-term momentum cools slightly, the longer-term uptrend is still intact.
The weight of evidence across ten technical indicators leans heavily bullish, with a cumulative score of 7 out of 10. RSI is reading 72.5, which sits in overbought territory but is not yet showing signs of exhaustion or hidden divergence. Mantle token price is sitting right at the upper Bollinger Band, signalling that volatility and directional strength remain elevated. Moving averages are stacked in a largely bullish configuration, MACD is showing positive momentum with the histogram still expanding, and on-balance volume is trending upward, confirming that accumulation is overriding distribution.
RSI: Overbought but not exhausted
The Relative Strength Index is reading 72.5, which places it firmly in overbought territory above the 70 threshold. This is typically interpreted as a warning signal that price has moved too far too fast, yet in strong trending markets, RSI can remain elevated for extended periods without immediately rolling over. The key observation here is that RSI has not yet shown a hidden divergence (where price makes a higher high but RSI makes a lower high), which would be a critical warning that momentum is fading beneath the surface.
Score: 8 / 10 | Bullish
Moving Averages: Price above key short-term support
The exponential moving averages paint a mixed but ultimately supportive picture. The EMA 20 sits at $0.50, the EMA 50 is at $0.47, and the EMA 100 is at $0.50, which means price at $0.57 is trading above all three of these intermediate-term anchors. However, the EMA 200 is at $0.58, sitting just $0.01 above the current price, which means Mantle crypto price is barely below the longest-term trend anchor. This suggests that while the immediate trend favours bulls, the macro trend is neutral to slightly bearish unless Mantle breaks back above $0.58 with conviction.
Score: 7 / 10 | Bullish
Bollinger Bands: Touching the ceiling
The Bollinger Bands are set with an upper band at $0.57, a middle band at $0.49, and a lower band at $0.41. The fact that MNT price is sitting exactly at the upper band signals that volatility is extended and price has reached the outer edge of the current trading range. When price touches or rides the upper Bollinger Band in a rising market, it typically indicates strong momentum, but it also means there is limited room for continued upside without a mean reversion pullback to the middle band around $0.49.
Score: 9 / 10 | Bullish
Fibonacci Retracements: Mid-range resistance zone
Between the swing high of $0.70 and the swing low of $0.39, Mantle price sits at $0.57, which falls between the 0.382 Fibonacci retracement level of $0.51 and the 0.500 level of $0.54. This places the current price in a structurally significant zone where buyers have historically demonstrated strength. The next Fibonacci targets sit at $0.58 (0.618 level) and $0.63 (0.786 level), which represents the path of least resistance if bullish momentum persists into early September.
Score: 7 / 10 | Bullish
Support Levels: A staircase of safety nets
The support structure beneath MNT price is robust and multi-layered: the first support sits at $0.57 (where price currently rests), followed by $0.52, then $0.51, and finally $0.49. Having support at the current price level is positive because it suggests that buyers are defending this zone actively. If price were to break below, the next meaningful floor is at $0.51, and a breach of that would bring $0.49 into focus, which aligns closely with the Bollinger Band midpoint and the lower EMA 50.
Score: 7.5 / 10 | Bullish
Resistance: Tightly packed overhead
The resistance picture is notably compressed and challenging. Above the current price, sellers have clustered supply at $0.59, $0.64, $0.66, and $0.70. The fact that resistance sits so close to the current price (just $0.02 away at $0.59) means that upside breakouts will require heavy volume and conviction to clear. The primary target of resistance sits at the previous swing high of $0.70, but getting there means scaling through four distinct resistance zones with minimal breathing room in between.
Score: 3 / 10 | Bearish
Trendline: Price holding above the 50-cent slope
The dominant ascending trendline is anchored at $0.53 and slopes upward as we move into the future. The current price of $0.57 is solidly above this trendline, confirming that the directional bias remains upward. A break below the $0.53 trendline level would signal that the intermediate uptrend has been compromised, and it would likely trigger an inversion of the short-term bullish bias into a consolidation or downtrend.
Score: 8 / 10 | Bullish
MACD: Momentum is still expanding
The MACD indicator shows a line value of 0.029586, a signal line of 0.023204, and a histogram of 0.006382. The line is above the signal, and critically, the histogram is positive and still expanding, which means momentum is accelerating rather than decelerating. This is one of the strongest confirmations of bullish directional strength across the entire suite of indicators. As long as the histogram remains positive and the line stays above the signal, the macro momentum story remains intact.
Score: 8.5 / 10 | Bullish
On-Balance Volume: Accumulation is winning
On-balance volume is trending upward, which confirms that buying volume is outpacing selling volume in aggregate. This is a crucial validation of the price rise, because it means the move from the swing low of $0.39 to the current price of $0.57 has been accompanied by genuine accumulation rather than thin manipulation. Rising OBV gives confidence that the uptrend has retail or institutional conviction behind it, rather than being driven purely by late speculation.
Score: 7 / 10 | Bullish
Chart Patterns: No clear formation yet
The chart does not currently display a recognisable classical pattern such as a head-and-shoulders, triangle, flag, or wedge. This is neutral: it means there is no measured profit target that we can draw from a completed pattern, but it also means there is no pattern failure risk that could invalidate a directional thesis. The absence of a clear pattern suggests the price action has been driven more by momentum and sentiment swings than by structured mean reversion mechanics.
Score: 5 / 10 | Neutral
Indicator | Reading | Score / 10 |
|---|---|---|
RSI (14) | Overbought at 72.5 but no divergence yet | 8 |
EMAs (20 / 50 / 100 / 200) | Short-term bullish, macro trend near neutral | 7 |
Bollinger Bands | Price at upper band signals extended volatility | 9 |
Fibonacci | Mid-range zone between 0.382 and 0.500 levels | 7 |
Support | Multiple layers from $0.57 down to $0.49 | 7.5 |
Resistance | Tightly packed overhead from $0.59 to $0.70 | 3 |
Trendline | Price above ascending $0.53 trend anchor | 8 |
MACD | Line above signal, histogram expanding positive | 8.5 |
On-Balance Volume | Rising trend confirms accumulation dominance | 7 |
Chart Patterns | No clear pattern, neutral structural signal | 5 |
Cumulative Average | Bullish bias, I'm going long | 7 |
I'm going long on Mantle MNT (buy MNT crypto) because the cumulative technical score of 7 out of 10 reflects genuine bullish momentum supported by rising on-balance volume, expanding MACD histogram, and a price structure that is testing resistance with conviction. My entry is timed to the current price action near $0.57, where the Bollinger Band upper boundary and the short-term moving average support are converging. I'm risking the break of the $0.49 support level, which would signal a failure of the intermediate uptrend.
My entry zone | $0.56 – $0.58 |
My stop loss | $0.48 (break below support cluster and Bollinger midpoint) |
My target 1 | $0.59: immediate resistance |
My target 2 | $0.64: secondary resistance cluster |
My target 3 | $0.70: swing high retest |
Risk : Reward | 1 : 1.1 (T1) / 1 : 2.2 (T2) |
Position | Long / leveraged long |
I would exit my long position if Mantle price breaks and closes below $0.49 on the daily timeframe, which would represent a violation of the key support zone and a break back below the Bollinger Band midpoint. This level also sits at the junction of the EMA 50 and prior support, so a close below $0.49 would indicate that accumulation has lost momentum and distribution is taking control. I would flip to a neutral or short bias if price also breaks below the ascending trendline at $0.53 simultaneously, which would be a double confirmation of trend reversal.
Disclaimer: This article is produced for informational and educational purposes only and does not constitute financial or investment advice. Cryptocurrency markets are highly volatile and carry significant risk. Always conduct your own research and consult a qualified financial adviser before making any trading decisions.
This altcoin is flashing green signals across nearly every indicator, but one major warning sign could derail the upside.
 STG
STG
A small altcoin is staging a quiet rally. Here's why traders are watching closely.
 ZBCN
ZBCN-768x432.png&w=3840&q=75&dpl=dpl_2a1LjK7J47ZhhwjhB7eFPuxwceT3)
A small-cap token just flipped bullish. Most traders haven't noticed yet.
 INIT
INIT
