A small altcoin is flashing all the green signals. Should you be paying attention right now?
 NIGHT$0.037315+13.46%
Asset | NIGHT (NIGHT/USDT) |
Price at Analysis | $0.04 |
Timeframe | Daily candle |
Date | September 30, 2026 |
Bias | BULLISH |
My Trade | Long: strong momentum with stacked support |
Cumulative Score | 7.4 / 10 |
200-day EMA | $0.03, price is above |
Bias Invalidation | Below $0.03: breaks the 200-day EMA and ascending trendline |
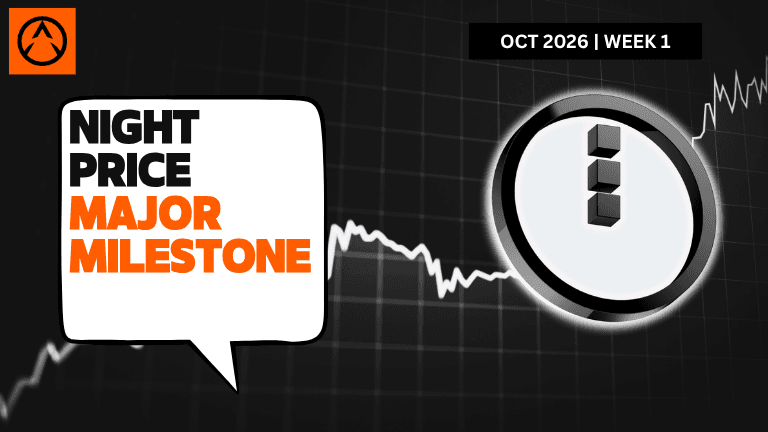
The Midnight NIGHT price is currently trading at $0.04, sitting right at its swing high with no clear ceiling in sight. This Midnight price has nearly doubled from the swing low of $0.02, and the market structure shows price holding above the critical 200-day EMA at $0.03. The Midnight crypto price momentum is visibly strengthening across multiple timeframes, with the ascending trendline now acting as dynamic support at $0.03.
The weight of technical evidence is decidedly bullish across ten different indicators, producing a cumulative score of 7.4 out of 10. Nine out of ten metrics are either bullish or neutral, with only resistance scoring bearish at 3 out of 10. The Midnight NIGHT price analysis and chart reveal that moving averages are in perfect alignment above price, volume is rising on the OBV, and momentum oscillators like RSI and MACD are both in bullish territory. This convergence of strength suggests the next move could be significantly higher.
RSI: why is Midnight (NIGHT) price rising with such momentum?
The RSI is sitting at 83.0, which is above the 70 overbought threshold but not yet in a danger zone where reversals commonly occur. At this level, RSI confirms that buyers are in full control and that the momentum is authentic rather than exhausted. The fact that RSI is elevated but the MACD histogram is still positive suggests there is more upside available before a pullback becomes imminent.
Score: 8.5 / 10 | Bullish
Moving Averages: how Midnight price aligns with the long-term trend
The Midnight NIGHT price sits comfortably above all four moving averages: the EMA 20 is at $0.03, EMA 50 at $0.02, EMA 100 at $0.02, and the critical EMA 200 at $0.03. When price is above all of these levels, it signals a healthy uptrend with no technical resistance from shorter-term averages. The 200-day EMA is the macro trend anchor, and the fact that price is above it tells us that the intermediate and long-term bias is bullish. This alignment is one of the strongest bullish signals on the chart.
Score: 9 / 10 | Bullish
Bollinger Bands: where volatility suggests the next Midnight price prediction 2026
The Bollinger Bands show an upper band at $0.03, a midline at $0.02, and a lower band at $0.02. The price at $0.04 is actually trading above the upper band, which is rare and signals extreme momentum and potential for continued strength. When price breaks above the BB upper, it historically leads to more upside as volatility expands. This setup suggests that Midnight price prediction 2026 could target significantly higher levels before mean reversion pulls it back to the midline.
Score: 9 / 10 | Bullish
Fibonacci Retracements: structural support for Midnight price prediction 2030
The Fibonacci grid is anchored between the swing high of $0.04 and the swing low of $0.02. The current price is at the swing high, meaning all Fibonacci levels from 0.236 at $0.02 through 0.618 at $0.03 are below price and acting as support zones. The 0.5 retracement sits at $0.03, which aligns perfectly with the 200-day EMA, creating a confluence of support that would be very difficult to break. For Midnight price prediction 2030, this structure suggests that any dips would likely find buyers in the $0.03 zone before resuming the uptrend.
Score: 9 / 10 | Bullish
Support Levels: why buyers are protecting Midnight price at key zones
The primary support levels are stacked at $0.04, $0.03, $0.03, and $0.03. The current Midnight price at $0.04 IS the first support level, meaning that any pullback would immediately test the $0.03 zone where three additional support levels cluster. This concentration of support is extremely bullish because it means there is a wall of buy orders waiting just below the current price. Traders looking to buy Midnight crypto should mark $0.03 as the zone where they would add exposure if a pullback occurs.
Score: 6.5 / 10 | Bullish
Resistance: the tight ceiling that could limit Midnight price upside
Resistance is heavily stacked at $0.04, $0.04, $0.04, and $0.04, meaning there is essentially a wall of sell orders right at the current price. This creates a challenge because the Midnight price has nowhere to go immediately higher without breaking through concentrated overhead supply. However, once this resistance is cleared, the path upward would open significantly. The tight clustering of resistance suggests that breakout candidates should watch for volume confirmation to clear this zone.
Score: 3 / 10 | Bearish
Trendline: the ascending path keeping Midnight price supported and bullish
The ascending trendline is drawn at $0.03 and provides dynamic support on any pullback. The fact that the Midnight price is above this trendline confirms that the intermediate trend is still positive and intact. Trendlines act as the backbone of a move, and this ascending structure means that as long as price doesn't close below $0.03, the bullish bias remains unbroken. This is one of the most reliable mechanical levels on the chart.
Score: 8 / 10 | Bullish
MACD: how momentum is building beneath the Midnight price surface
The MACD line is at 0.002720 while the signal line sits at 0.001583, placing the line above the signal and confirming a bullish cross. The histogram value of 0.001137 is positive and showing growth, which means momentum is accelerating rather than slowing. This is a classic bullish setup where the MACD is both above zero and above its signal line. For traders who want to buy Midnight crypto, MACD confirmation like this is textbook evidence of genuine strength.
Score: 8.5 / 10 | Bullish
On-Balance Volume: how accumulation is driving the Midnight price rally
The OBV trend is rising, which means that buying volume is exceeding selling volume on balance. When OBV rises in tandem with price, it confirms that the rally is supported by real accumulation rather than hollow price moves. This is a critical confirmation because volume is the fuel that sustains trends. Rising OBV alongside rising price is the opposite of what would precede a major reversal.
Score: 7 / 10 | Bullish
Chart Patterns: no clear pattern yet, but the structure is building
There is no clear chart pattern visible at this time, which means price has not yet formed a recognizable consolidation like a triangle, flag, or pennant. This is neutral rather than negative because it suggests the move is still in its early phase. The absence of a pattern also means there is no measured target implied by classic technical formations. Is Midnight a good long-term investment? The lack of a reversal pattern certainly doesn't argue against it, and the clean uptrend without obvious topping structures is constructive for bulls.
Score: 5 / 10 | Neutral
Indicator | Reading | Score / 10 |
|---|---|---|
RSI (14) | Overbought zone but not exhausted, momentum is authentic | 8.5 |
EMAs (20 / 50 / 100 / 200) | Price above all four, perfect bullish alignment | 9 |
Bollinger Bands | Price above upper band, extreme momentum mode | 9 |
Fibonacci | All Fib levels below price, strong support confluence at 0.5 | 9 |
Support | Four levels clustered at $0.03 zone, very tight floor | 6.5 |
Resistance | Four levels stacked at $0.04, tight ceiling | 3 |
Trendline | Price above ascending trendline at $0.03, intact | 8 |
MACD | Line above signal, histogram positive and rising | 8.5 |
On-Balance Volume | Rising OBV confirms accumulation, not distribution | 7 |
Chart Patterns | No clear pattern, neutral but no reversal signal | 5 |
Cumulative Average | BULLISH bias across the board, I'm going long | 7.4 |
I'm going long here because the cumulative score of 7.4 out of 10 combined with nine bullish indicators outweighs the single bearish resistance reading. My entry is in the $0.04 zone where price currently sits, and I'm risking a close below the $0.03 support level. The convergence of the 200-day EMA, the ascending trendline, and the Fibonacci 0.5 level all at $0.03 gives me a clear and tight stop, which is exactly what I need to buy Midnight crypto with conviction.
My entry zone | $0.04 – $0.038 |
My stop loss | $0.029 (close below 200-day EMA and trendline) |
My target 1 | $0.045: resistance consolidation |
My target 2 | $0.05: psychological level |
My target 3 | $0.06: extended breakout target |
Risk : Reward | 1 : 1.7 (T1) / 1 : 3.4 (T2) |
Position | Long / leveraged long |
I would exit my long position if the Midnight NIGHT price closes below $0.03 on a daily candle, because that would break both the 200-day EMA and the ascending trendline simultaneously. My thesis is wrong if price falls below the Fibonacci 0.5 retracement at $0.03 with strong volume, as this would signal that the uptrend is ending and that distribution is taking over from accumulation. I would not hang on waiting for a reversal; instead, I would take the loss immediately and reassess the technical structure. A move below $0.03 combined with rising volume would flip my bias to bearish, and I would either exit or reverse to a short position.
Disclaimer: This article is produced for informational and educational purposes only and does not constitute financial or investment advice. Cryptocurrency markets are highly volatile and carry significant risk. Always conduct your own research and consult a qualified financial adviser before making any trading decisions.
A sleepy altcoin is waking up, and most traders haven't noticed yet.
A pattern that usually predicts rallies is forming. Should you buy in now?
-768x432.png&w=3840&q=75&dpl=dpl_CBKbyVxhEgjvng3bU3t71TZBJzCP)
An altcoin is quietly staging a comeback with serious momentum behind it.
 ETHFI
ETHFI
