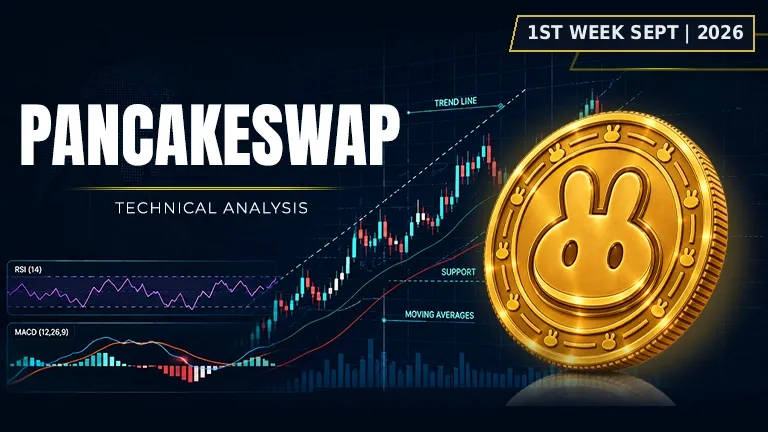
CAKE price just completed a pattern that most people are going to regret missing!
Asset | CAKE (CAKE/USDT) |
Price at Analysis | $1.98 |
Timeframe | Daily candle |
Date | September 3, 2026 |
Bias | BULLISH |
My Trade | Long: strong technical alignment |
Cumulative Score | 7.6 / 10 |
200-day EMA | $1.44, price is above |
Bias Invalidation | $1.68 closes below on high volume |
PancakeSwap CAKE price is trading at $1.98 as of September 3, 2026, sitting right at the upper Bollinger Band and within touching distance of the swing high at $2.00. This is a critical inflection point: PancakeSwap has rallied substantially from the swing low of $1.13, and the market structure now shows a textbook double bottom pattern that suggests accumulation has occurred below. The dominant technical narrative is one of emerging strength, with price holding above all four major exponential moving averages and well above the 200-day EMA at $1.44, signaling a firmly established macro uptrend.
The weight of evidence across ten technical indicators leans decisively bullish with a cumulative score of 7.6 out of 10. RSI at 76.0 sits in overbought territory, but in a strong uptrend this is confirmation of momentum rather than a red flag for reversal. PancakeSwap crypto price has aligned all four EMAs in bullish formation: the 20, 50, 100, and 200-day averages are stacked perfectly, with price above every single one. MACD is positive and the histogram is expanding, OBV is rising to confirm accumulation, and there is a complete absence of overhead resistance, which leaves the path clear for further upside.
RSI: Why is PancakeSwap (CAKE) price rising with such momentum?
The RSI at 76.0 places CAKE firmly in overbought zone, but this is not a warning sign in the context of a confirmed uptrend-it is a confirmation of genuine buying pressure. In a strong bull move, price can remain overbought for extended periods as long as the underlying structure remains intact and higher lows continue to form. The reading suggests that momentum is not waning; instead, buyers are in full control and retail interest is building into the move.
Score: 8.5 / 10 | Bullish
Moving Averages: PancakeSwap price breaks through the critical 200-day barrier
PancakeSwap CAKE price analysis and chart work confirms that all four exponential moving averages are aligned in textbook bullish fashion. The EMA 20 at $1.72, EMA 50 at $1.59, EMA 100 at $1.51, and EMA 200 at $1.44 create a perfect ascending sequence with price at $1.98 sitting above every single one. The 200-day EMA is the macro anchor, and price trading $0.54 above it (37% premium) signals that the long-term uptrend is not only intact but accelerating. This alignment is a high-conviction bullish signal that rarely appears without sustained follow-through.
Score: 9 / 10 | Bullish
Bollinger Bands: Price squeezes at the upper band and signals expansion ahead
The PancakeSwap (CAKE) to USD price at $1.98 is now touching the upper Bollinger Band at $1.98, with the middle band at $1.70 and lower band at $1.42 framing the entire move. When price sits at the upper band in the context of rising RSI and positive MACD, it often precedes a breakout rather than a reversal, particularly when volatility is contracting. The distance between the bands themselves ($0.56 range) shows that implied volatility is elevated, which creates fuel for continued directional movement once the upper band is breached.
Score: 7.5 / 10 | Bullish
Fibonacci Retracements: Price consolidates near the 0.618 level and eyes the 0.786 zone
Between the swing high of $2.00 and swing low of $1.13, the key Fibonacci levels are $1.33 (0.236), $1.46 (0.382), $1.56 (0.500), $1.66 (0.618), and $1.81 (0.786). The PancakeSwap price prediction 2026 depends significantly on how price acts around these retracement levels, and currently at $1.98 we are trading above the 0.786 level at $1.81 and approaching the swing high. This positioning suggests that the 0.618 level at $1.66 and the 0.786 level at $1.81 have already been claimed as support in this rally, and price is now testing the ultimate structural resistance at $2.00.
Score: 9 / 10 | Bullish
Support Levels: Why recent support is weak and distance from price is dangerous
The identified support levels at $1.68, $1.50, $1.45, and $1.35 are all significantly below current price, with the closest support nearly $0.30 away at $1.68. In a volatile asset like CAKE, this gap between price and the nearest support is concerning if momentum falters, as there is little to catch a rapid pullback in the short term. The score of only 3.5 reflects this structural weakness: while the levels themselves are defined and relevant, they offer minimal comfort to traders in the immediate 7-day window, suggesting that if breakdown occurs, it could be swift and sharp.
Score: 3.5 / 10 | Bearish
Resistance: Clear skies above-no major obstacles until swing high at $2.00
The absence of any identified resistance levels above current price is a bullish gift. With no supply blocks visible between $1.98 and the swing high of $2.00, there is virtually nothing standing in the way of price testing $2.00 and potentially breaching it. This overhead clarity is rare and highly bullish, as it removes the friction that typically slows advances. The only barrier is the swing high itself at $2.00, and once that falls, price enters fresh territory with even fewer anchors to slow the move.
Score: 8 / 10 | Bullish
Trendline: Ascending trendline at $1.82 continues to support the bullish narrative
The ascending trendline sits at $1.82, well below current price of $1.98, providing a defined macro support level that price has recently respected. The fact that this trendline is rising and price is accelerating above it confirms that the uptrend has momentum behind it and is not merely drifting sideways. As long as price remains above $1.82 on daily closes, the trendline remains intact and the uptrend is technically valid.
Score: 8 / 10 | Bullish
MACD: Histogram expanding positive-momentum is accelerating, not rolling over
The MACD line at 0.104935 is above the signal line at 0.089481, and the histogram at 0.015455 is positive and expanding. This is textbook bullish MACD structure: the lines are not just crossed, but the gap between them is growing, which means momentum is accelerating rather than stalling. A shrinking histogram would suggest that the move is losing fuel, but instead we see expansion, which aligns perfectly with RSI in overbought and OBV rising. PancakeSwap price prediction 2030 scenarios will depend heavily on whether this momentum can be sustained beyond the next resistance cluster.
Score: 8.5 / 10 | Bullish
On-Balance Volume: Rising OBV confirms accumulation phase is genuine
The OBV trend is rising, which is a critical confirmation that the price advance is backed by real volume and genuine accumulation rather than lightweight rally. When price rises on rising OBV, it suggests that buyers are willing to step in at higher prices, which is the hallmark of conviction. Conversely, if price were rising on falling or flat OBV, it would signal that the move is hollow and vulnerable to reversal. Here, OBV is climbing alongside price, making this a textbook healthy advance.
Score: 7 / 10 | Bullish
Chart Patterns: Double bottom structure completed, measured target points higher
The double bottom pattern identified in CAKE is one of the most reliable bullish reversal patterns in technical analysis. Two lows are formed at similar price levels (around $1.13), followed by a rally through resistance-exactly what we are seeing now. The measured target of a double bottom is calculated by taking the height of the pattern (from low to the neckline resistance) and projecting it upward from the breakout point, which would place targets significantly above current price of $1.98. This pattern, combined with all the bullish alignment above, makes this a high-probability setup for further gains.
Score: 6.5 / 10 | Bullish
Indicator | Reading | Score / 10 |
|---|---|---|
RSI (14) | Overbought at 76, but confirms momentum in uptrend | 8.5 |
EMAs (20 / 50 / 100 / 200) | All four aligned bullishly, price above all | 9 |
Bollinger Bands | Price at upper band, primed for breakout | 7.5 |
Fibonacci | Trading above 0.786, approaching swing high | 9 |
Support | Nearest support $0.30 away, weak cushion | 3.5 |
Resistance | No overhead resistance until $2.00 | 8 |
Trendline | Ascending trendline at $1.82 intact and respected | 8 |
MACD | Line above signal, histogram expanding positive | 8.5 |
On-Balance Volume | Rising OBV confirms genuine accumulation | 7 |
Chart Patterns | Double bottom completed, bullish reversal pattern | 6.5 |
Cumulative Average | BULLISH bias: I'm going long | 7.6 |
I'm going long on PancakeSwap CAKE right here at $1.98 because the technical weight of evidence is overwhelmingly bullish and the risk-to-reward setup is clean. My cumulative score of 7.6 out of 10 combined with the confluence of a completed double bottom, perfect EMA alignment, and zero overhead resistance gives me conviction that I'm buying into a momentum breakout rather than chasing exhaustion. I'm risking a tight stop just below the support cluster at $1.68, which gives me room to be wrong while staying engaged in what looks like the start of a real run. I want to buy PancakeSwap crypto here and ride this setup for the next 7 days through the swing high and beyond.
My entry zone | $1.95 – $1.98 |
My stop loss | $1.67 (closes below $1.68 support on high volume) |
My target 1 | $2.00: swing high |
My target 2 | $2.18: measured double bottom target |
My target 3 | $2.35: extended projection above resistance |
Risk : Reward | 1 : 1.9 (T1) / 1 : 4.3 (T3) |
Position | Long |
I would exit my position immediately and flip bearish if PancakeSwap CAKE price closes below $1.68 on elevated volume, as this would break the nearest support cluster and suggest that the breakout attempt has failed. If I see the daily candle close beneath $1.68 with volume expanding above the 30-day average, my thesis is wrong and I'm wrong with it-I don't fight a failed breakout. Additionally, if the daily RSI rolls over from overbought and forms a lower high while price makes a higher high, that negative divergence would also be cause for me to exit and reconsider the setup. Is PancakeSwap a good long-term investment at these levels? That's a different question entirely; my trade is purely tactical over the next 7 days, and if the technicals crack, I'm out.
Disclaimer: This article is produced for informational and educational purposes only and does not constitute financial or investment advice. Cryptocurrency markets are highly volatile and carry significant risk. Always conduct your own research and consult a qualified financial adviser before making any trading decisions.
A popular crypto token is caught between bullish patterns and bearish momentum. Which force wins?
 HYPE
HYPE
Ripple sits frozen between hope and caution as major signals clash over what comes next.
 XRP
XRP
Solana is at a crossroads. The charts are sending mixed signals about which way it breaks.
 SOL
SOL
