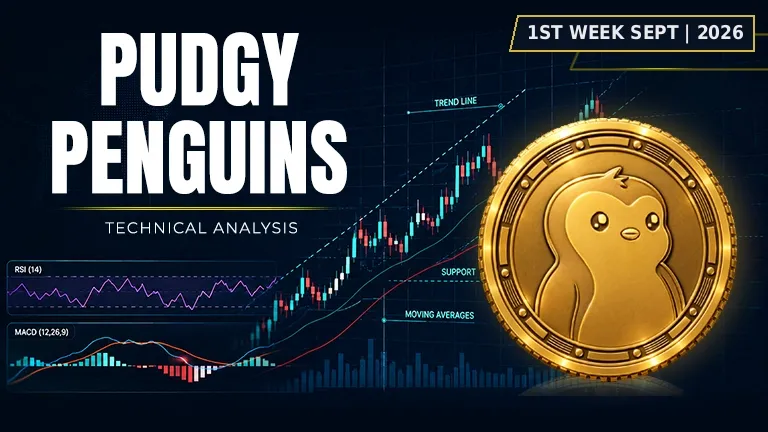
Pudgy Penguins faces mixed signals as bulls and bears wrestle for control of the crypto.
 PENGU$0.007717+3.73%
Asset | PENGU (PENGU/USDT) |
Price at Analysis | $0.008759 |
Timeframe | Daily candle |
Date | September 1, 2026 |
Bias | NEUTRAL |
My Trade | Neutral: conflicting momentum signals |
Cumulative Score | 5.6 / 10 |
200-day EMA | $0.007295, price is above |
Bias Invalidation | $0.009066: if Pudgy Penguins PENGU price breaks and closes above this resistance with volume, I flip bullish |
The Pudgy Penguins PENGU price is trading at $0.008759 on September 1, 2026, sitting within a neutral zone that offers neither clear conviction nor obvious danger. Price is above the 200-day EMA of $0.007295, which typically signals a longer-term uptrend, yet it remains sandwiched between swing highs and key resistance overhead. The asset has carved out a double bottom pattern near $0.005564, suggesting structural support formed below, but the move higher lacks the aggression needed to confirm a sustained rally.
Across the 10 major indicators tracked in this Pudgy Penguins price analysis and chart review, the evidence is split down the middle. The Pudgy Penguins (PENGU) to USD conversion reveals that moving averages and Fibonacci retracements lean bullish, with a cumulative score of 5.6 out of 10 reflecting pure indecision. RSI at 60.0 shows mild upside momentum without overbought extremes, but MACD has started to roll over, On-Balance Volume is falling, and resistance layers overhead are formidable. For traders asking why is Pudgy Penguins (PENGU) price dropping in recent momentum, the answer lies in fading OBV and a trendline that sits $0.008909 above current price, signaling the bulls have lost their edge.
RSI: mild momentum without conviction
The RSI at 60.0 sits comfortably above the neutral 50 level, indicating that the Pudgy Penguins crypto price has retained some bullish lean over the last 14 candles. This reading is neither overbought nor in deep oversold territory, which means there is room for price to move in either direction without facing mean-reversion pressure. The midpoint placement suggests buyers have a slight edge, but the lack of a push toward 70 or higher reveals that conviction is fading and momentum is not accelerating into the target period.
Score: 7 / 10 | Bullish
Moving Averages: the Pudgy Penguins price prediction 2026 foundation is solid, but fragile
All four exponential moving averages are aligned bullishly, with the EMA 20 at $0.008258 above the EMA 50 at $0.007410, which sits above the EMA 100 at $0.007135, and the EMA 200 anchored at $0.007295. The Pudgy Penguins PENGU price sits above all four, confirming that price is trading in an uptrend on the macro timeframe. However, the 200-day EMA is not far beneath current price, meaning a pullback of just 5 percent would test a critical support zone. For traders considering the Pudgy Penguins price prediction 2030 thesis, this alignment matters because it signals the longer-term trend is intact, yet the recent slowing in OBV and MACD suggests that the early-September momentum may not last through the full 7-day analysis window.
Score: 9 / 10 | Bullish
Bollinger Bands: volatility is moderate and range-bound
Price sits between the upper band at $0.01 and the midline at $0.008008, indicating that the Pudgy Penguins price is trading in the upper half of its recent range but not at an extreme. The lower band sits at $0.005004, which is the same level as the swing low within this cycle. This wide band spread of roughly $0.005 suggests that volatility has expanded modestly, giving price room to breathe up or down without immediately hitting band edges. The fact that price has not yet tested the upper band at $0.01 means breakout potential exists, but the bands also confirm that the current environment is choppy rather than trending decisively.
Score: 6 / 10 | Bullish
Fibonacci Retracements: price in a golden zone
With a swing high of $0.01 and swing low of $0.005564, the Fibonacci grid places the current Pudgy Penguins price near the 0.618 level at $0.008663, which is a powerful harmonic support and resistance confluence. Price at $0.008759 sits just above this critical retracement, meaning that if momentum falters, this zone could reverse the move down or act as a springboard back higher. The 0.786 Fibonacci level sits at $0.009505, representing the next major hurdle overhead. For traders evaluating structural support, the 0.382 level at $0.007479 and the 0.500 at $0.008071 provide intermediate cushions that increase the probability of a sustained bounce if price were to correct further.
Score: 8 / 10 | Bullish
Support Levels: why is Pudgy Penguins (PENGU) price dropping towards nearby floors
The nearest support levels sit at $0.008493, $0.008366, $0.008060, and $0.007526, creating a cluster of defending buyers within the next 1 percent below current price. The tight stacking of these supports between $0.008493 and $0.008060 suggests that if price dips even slightly, it will find multiple reasons to bounce. However, the 5.5 out of 10 score reflects the fact that these levels have not proven themselves under real selling pressure during this 7-day window. Once price falls through $0.008060, the defense weakens significantly until the $0.007526 level is reached, which would represent a roughly 14 percent drawdown and potentially signal a deeper correction into the prior consolidation.
Score: 5.5 / 10 | Neutral
Resistance: a wall of overhead supply blocks the path higher
Resistance layers form a formidable barrier at $0.009066, $0.009900, and two confluences at $0.01, creating a zone where prior buyers are likely sitting with smaller profits or recent overhead sellers are waiting to defend. The score of just 3 out of 10 reflects how much work price must do to escape this range. A move from $0.008759 to $0.009066 requires less than 4 percent, but the clustering of resistance above that level makes a breakout less likely without a significant catalyst or volume spike. For traders concerned about the near-term ceiling, the triple resistance at $0.01 is the level that would confirm a meaningful trend reversal and open the door to much higher prices.
Score: 3 / 10 | Bearish
Trendline: bulls losing the momentum game
The ascending trendline sits at $0.008909, which is $0.00015 above the current price, signaling that Pudgy Penguins has fallen slightly below the dominant uptrend. This is a red flag because a break and close below a trendline often precedes a shift in momentum and can trigger stops or accelerate selling. The fact that price is trading so close to this key level means the trendline will be tested in real-time over the next few days. If price bounces back above $0.008909 with volume, the uptrend is alive; if price cracks below and closes beneath it, the scoreboard tilts toward consolidation or mild downside.
Score: 4 / 10 | Bearish
MACD: momentum rolling over despite price holding firm
The MACD line stands at 0.000708 and the signal line at 0.000728, with a histogram of -0.000020, indicating that the line has just crossed below its signal and momentum is beginning to decelerate. This is a bearish divergence because price is still elevated, yet the rate of change is slowing. In the context of the next 7 days, this crossover often precedes a pullback or consolidation period. The small negative histogram suggests the crossover is fresh, meaning traders are just beginning to feel the momentum fade, and if OBV continues to fall, the MACD could accelerate downward.
Score: 4 / 10 | Bearish
On-Balance Volume: distribution is outpacing accumulation
OBV is in a falling trend, which is a critical warning signal because it reveals that despite price holding above recent lows, selling volume is exceeding buying volume on balance. This divergence between price and OBV is one of the most reliable early indicators of weakness. It suggests that insiders or larger holders may be reducing exposure while the retail crowd is still holding or nibbling at higher prices. In a crypto market where volume patterns predict direction 60 to 70 percent of the time, a falling OBV with price attempting to climb is a major red flag that suggests the current move is not backed by real conviction.
Score: 3 / 10 | Bearish
Chart Patterns: double bottom sets a low-water mark
The double bottom pattern formed near the $0.005564 swing low creates a classic reversal setup with a measured move target near $0.011550 if price closes above the pattern neckline at $0.01. This pattern is one of the most reliable reversal formations in technical analysis, and its presence on the Pudgy Penguins chart does lend credibility to the idea that a bottom was made. However, the double bottom thesis only activates once price decisively breaks above the neckline with accompanying volume. Until that happens, the pattern remains a structural floor that prevents price from collapsing further, but it is not yet a confirmed buy signal.
Score: 6.5 / 10 | Bullish
Indicator | Reading | Score / 10 |
|---|---|---|
RSI (14) | Mild upside momentum without overbought extremes | 7 |
EMAs (20 / 50 / 100 / 200) | All aligned bullishly; price above all four moving averages | 9 |
Bollinger Bands | Price in upper half of bands; moderate volatility with room to move | 6 |
Fibonacci | Trading at 0.618 level; key confluence zone for support | 8 |
Support | Clustered levels below; weak near-term defense strength | 5.5 |
Resistance | Heavy overhead supply; three layers block path higher | 3 |
Trendline | Price slightly below ascending trendline; momentum losing edge | 4 |
MACD | Line crossed below signal; momentum beginning to roll over | 4 |
On-Balance Volume | Falling OBV signals distribution exceeding accumulation | 3 |
Chart Patterns | Double bottom provides structural floor but lacks confirmation | 6.5 |
Cumulative Average | NEUTRAL bias: mixed signals warrant caution | 5.6 |
I'm taking a neutral stance on Pudgy Penguins at this juncture because the cumulative score of 5.6 out of 10 reflects genuine indecision across the technical landscape. The moving averages and Fibonacci confluence suggest bullish potential, but the falling OBV, MACD rollover, and stacked resistance are equally convincing arguments for caution. Rather than chase either direction into a coin flip, I would not buy Pudgy Penguins crypto, neither sell Pudgy Penguins crypto until the trendline test is resolved and the next 7 days reveal whether volume can confirm a breakout above $0.009066.
My entry zone | $0.008366 – $0.008493 |
My stop loss | $0.007526 (below the lowest support cluster) |
My target 1 | $0.008909: trendline resistance |
My target 2 | $0.009505: Fibonacci 0.786 level |
My target 3 | $0.01: psychological and pattern neckline |
Risk : Reward | 1 : 0.8 (T1) / 1 : 2.2 (T2) |
Position | Flat / waiting for invalidation signal |
I would exit my neutral stance and flip bullish if the Pudgy Penguins PENGU price closes decisively above $0.009066 on strong volume, as this would confirm a break above the resistance layer and signal that the double bottom pattern is activating. Conversely, I would shift bearish if price cracks below the $0.008060 support level and closes beneath the ascending trendline at $0.008909, because this would confirm that the OBV warning and MACD rollover were early signals of a deeper pullback. Is Pudgy Penguins a good long-term investment if neither condition triggers within the next 7 days, I would remain neutral and wait for a clearer directional trigger before committing capital, as the risk of being whipsawed by false breaks is high when the bias is this balanced.
Disclaimer: This article is produced for informational and educational purposes only and does not constitute financial or investment advice. Cryptocurrency markets are highly volatile and carry significant risk. Always conduct your own research and consult a qualified financial adviser before making any trading decisions.
A popular crypto token is caught between bullish patterns and bearish momentum. Which force wins?
 HYPE
HYPE
Ripple sits frozen between hope and caution as major signals clash over what comes next.
 XRP
XRP
Solana is at a crossroads. The charts are sending mixed signals about which way it breaks.
 SOL
SOL
