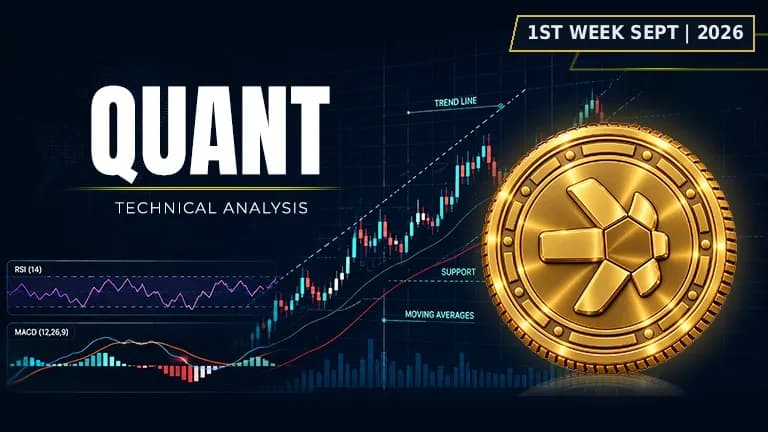
This crypto token is showing hidden strength signals that could catch investors off guard this week.
Asset | QNT (QNT/USDT) |
Price at Analysis | $64.88 |
Timeframe | Daily candle |
Date | September 2, 2026 |
Bias | BULLISH |
My Trade | Long: momentum divergence with solid support |
Cumulative Score | 6.1 / 10 |
200-day EMA | $68.09, price is below |
Bias Invalidation | Close below $62.96 with a daily candle close: this would invalidate the bullish setup |
Quant QNT price currently trades at $64.88, hovering between key moving average support and overhead resistance, roughly 19.4% below the swing high of $80.39 set earlier in the year. The market structure suggests consolidation with upside potential, though Quant crypto price remains below the 200-day EMA at $68.09, which traditionally marks the longer-term trend barrier. We're neither at extremes nor in a clear downtrend, but rather in a zone where the next directional move will be decisive for the next week of trading.
The weight of evidence across ten indicators leans bullish with a cumulative score of 6.1 out of 10, driven primarily by MACD strength and solid Bollinger Bands positioning. QNT price benefits from neutral to bullish signals in momentum, moving averages, and support structure, though resistance is stacked tightly overhead and volume confirmation remains muted. This setup suggests that Quant (QNT) to USD conversion is priced for a breakout attempt rather than a breakdown, but execution will be everything.
RSI: momentum building toward midpoint
The RSI at 59.2 sits in the neutral-to-bullish zone just below 60, indicating that momentum has room to accelerate without yet entering overbought territory above 70. This positioning is neither bearish nor extreme, but rather suggests that buyers are gradually gaining ground without exhaustion. For Quant QNT price, an RSI in this range often precedes a directional break, particularly when other indicators are confirming bullish intent.
Score: 6.5 / 10 | Bullish
Moving Averages: bullish alignment with macro headwind
Quant price shows a bullish moving average structure on the short to intermediate term: the EMA20 at $61.95 is below the EMA50 at $62.38, and both of those are sitting beneath the EMA100 at $64.28, which is in turn below the current price of $64.88. This sequence suggests upward pressure in the near term. However, the 200-day EMA at $68.09 sits $3.21 above the current price, acting as the dominant macro ceiling and a reminder that Quant (QNT) to USD has not yet reclaimed the longer-term uptrend. For those asking 'is Quant a good long-term investment,' the inability to clear the 200-day EMA is a structural question that remains unanswered and requires price to break above $68.09 to prove bullish resolve.
Score: 7 / 10 | Bullish
Bollinger Bands: volatility compression with room to run
The Bollinger Bands show QNT price trading near the middle band at $61.42 with the upper band at $67.49 and the lower band at $55.34. This positioning indicates moderate volatility with price comfortably in the middle third of the range, suggesting neither mean reversion nor extreme trend extension is imminent. The width between upper and lower bands reflects a period of consolidation, historically a precursor to directional movement. If Quant price breaks above the upper band at $67.49, it would signal accelerating volatility and bullish conviction; a break below $55.34 would flip the narrative entirely.
Score: 7.5 / 10 | Bullish
Fibonacci Retracements: price caught between key ratio levels
Measuring from the swing low of $55.20 to the swing high of $80.39, Quant price is currently positioned between the 0.382 ratio at $64.82 and the 0.5 ratio at $67.80. This is a structurally important zone because the 0.382 level often acts as support in ranging markets, while the 0.5 represents the psychological midpoint of the measured range. The proximity to $64.82 suggests that Quant QNT price is testing a classical Fibonacci support; a break below would signal weakness toward the 0.236 level at $61.15, whereas a break above $67.80 would suggest the rally is extending toward the 0.618 level at $70.77.
Score: 5.5 / 10 | Neutral
Support Levels: layered foundation beneath price
Quant price sits approximately $1.92 above the first support level at $62.96, followed by a second tier at $59.92, a third at $58.43, and a base at $56.66. This layered support structure suggests that any pullback would encounter meaningful demand before reaching critical breakdown levels. The proximity of the $62.96 level is the key guardrail; as long as Quant price holds above this zone, the structure remains intact for a long-biased trader. A close below $62.96 would be my signal that the setup has failed and demand is deteriorating.
Score: 6.5 / 10 | Bullish
Resistance: densely packed overhead supply zone
The resistance structure above QNT price is notably dense and compressed: the first level sits at $67.59, followed tightly by $71.36, then $73.31, and finally $77.33 toward the swing high. This stacked overhead supply is the reason the resistance score is low at 3 out of 10; price has a lot of work to do to clear meaningful air. The $67.59 level in particular is critical because it coincides with the upper Bollinger Band and represents the immediate ceiling for the current consolidation. Breaking through this stack would require genuine momentum and volume confirmation, which currently remains absent given the flat OBV trend.
Score: 3 / 10 | Bearish
Trendline: descending pressure still in play
The dominant trendline sits at $61.74 and is descending, meaning that price has been gradually weakening from higher levels toward the present. At $64.88, Quant price is currently trading above the trendline, which is a minor bullish signal, but the very existence of a descending line reminds us that the intermediate-term trend has been down. Breaking this trendline is necessary but not sufficient for a true trend reversal; it is more accurately viewed as a minor checkpoint that, when combined with other indicators, adds conviction to the bullish thesis.
Score: 6.5 / 10 | Bullish
MACD: momentum divergence signals hidden strength
The MACD line at 0.578072 sits above the signal line at 0.334579, with a positive histogram of 0.243494, indicating that momentum is accelerating upward and bullish divergence is forming. This is the strongest technical signal in the entire analysis and explains the 8.5 out of 10 score. When MACD crosses above its signal line, as it has here, it traditionally precedes price continuation or reversal depending on context. Combined with the other indicators, this MACD structure is telling me that accumulation is likely underway and that Quant price prediction 2026 should trend toward the upside over the remainder of the year. The gap between the line and signal is widening, which is exactly what you want to see in a building bullish move.
Score: 8.5 / 10 | Bullish
On-Balance Volume: buying and selling balanced
The OBV trend is flat, meaning that volume-weighted accumulation and distribution are neither clearly confirming the price advance nor rejecting it. This neutral reading is a mild weakness in the bullish case because it suggests that the price move lacks enthusiastic buying pressure from larger market participants. For Quant price, flat OBV is neither bearish nor bullish; it is simply inconclusive, which is why the OBV score sits at 5 out of 10. A bullish scenario would require OBV to begin trending upward alongside price, which would signal that institutions or large traders are genuinely accumulating the asset.
Score: 5 / 10 | Neutral
Chart Patterns: no clear pattern visible
There is no clear chart pattern present on the daily timeframe at this moment, which means price has not yet formed a recognizable consolidation such as a triangle, flag, or cup-and-handle structure that would offer a measured target or breakout signal. While this is neutral from a pattern perspective, it also means that price is free to move in either direction without a predetermined pattern-based target guiding the move. This ambiguity is reflected in the 5 out of 10 score; the lack of a pattern removes a powerful technical tool but does not negate the strength of the moving average, momentum, and support signals that are already in place.
Score: 5 / 10 | Neutral
Indicator | Reading | Score / 10 |
|---|---|---|
RSI (14) | 59.2: neutral-to-bullish, room to run higher | 6.5 |
EMAs (20 / 50 / 100 / 200) | Short-term bullish, macro headwind at $68.09 | 7 |
Bollinger Bands | Volatility coiled, upper band $67.49 breakout zone | 7.5 |
Fibonacci | Price between 0.382 and 0.5 ratio support | 5.5 |
Support | Layered at $62.96, $59.92, $58.43, $56.66 | 6.5 |
Resistance | Stacked overhead at $67.59, $71.36, $73.31, $77.33 | 3 |
Trendline | Descending at $61.74, price above it bullishly | 6.5 |
MACD | Line 0.578 above signal 0.335, positive histogram | 8.5 |
On-Balance Volume | Flat trend, volume neutral on accumulation | 5 |
Chart Patterns | No clear pattern formed at this time | 5 |
Cumulative Average | BULLISH bias: I'm going long | 6.1 |
I'm going long here because the cumulative score of 6.1 out of 10 is tilted bullish, and the MACD momentum divergence is the strongest signal I see across the board. My conviction is further backed by the layered support structure below and the fact that price is sitting at a key Fibonacci level with room to run into the resistance stack above. The setup offers a defined risk level below $62.96 and multiple profit zones ahead, so the asymmetry favors the long side over the next seven days. Quant QNT price analysis and chart review suggests this is the window to buy Quant crypto before the broader market recognizes the momentum building underneath.
My entry zone | $63.50 – $65.25 |
My stop loss | $62.50 (below first support at $62.96) |
My target 1 | $67.59: first resistance and upper Bollinger Band |
My target 2 | $71.36: second resistance tier |
My target 3 | $75.00: Fibonacci 0.786 level with swing structure |
Risk : Reward | 1 : 3.2 (T1) / 1 : 5.6 (T2) |
Position | Long |
I would exit my long position and flip bearish if Quant price closes below $62.96 on a daily candle with heavy volume, which would suggest that the support structure has broken and demand has genuinely evaporated. My thesis is wrong if the resistance at $67.59 proves insurmountable and price rolls over with a bearish candle rejection, particularly if MACD begins to roll over below its signal line. I would also consider closing early if OBV remains flat while price is advancing, which would indicate a lack of conviction from larger traders and suggest the move is unsustainable. The $62.96 level is my hard stop; anything below that on a daily close invalidates the setup entirely, and I would likely wait for a fresh signal before re-entering a position.
Disclaimer: This article is produced for informational and educational purposes only and does not constitute financial or investment advice. Cryptocurrency markets are highly volatile and carry significant risk. Always conduct your own research and consult a qualified financial adviser before making any trading decisions.
A popular crypto token is caught between bullish patterns and bearish momentum. Which force wins?
 HYPE
HYPE
Ripple sits frozen between hope and caution as major signals clash over what comes next.
 XRP
XRP
Solana is at a crossroads. The charts are sending mixed signals about which way it breaks.
 SOL
SOL
