Solana is flashing strong buying signals, but resistance is getting tighter.
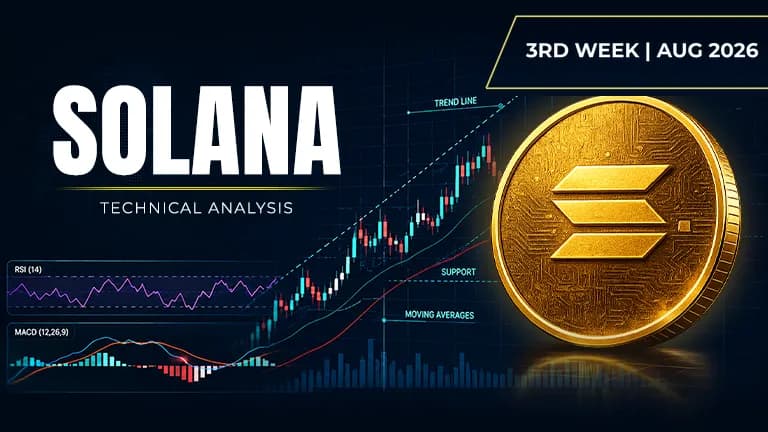
 SOL$119.73+1.32%
Asset | SOL (SOL/USDT) |
Price at Analysis | $87.56 |
Timeframe | Daily candle |
Date | August 20, 2026 |
Bias | BULLISH |
My Trade | Long: multiple bullish confirmations converging |
Cumulative Score | 7.2 / 10 |
200-day EMA | $81.25, price is above |
Bias Invalidation | Close below $86.99 with conviction, thesis flips bearish |
SOL is trading at $87.56, sitting $8.44 below its recent swing high of $96.00 and comfortably above the 200-day EMA at $81.25. The coin is in the upper half of its recent range, having climbed from the $60.14 swing low, and the overall tone is decidedly optimistic. Price is trading above all four key moving averages, suggesting the intermediate-term structure remains healthy.
The weight of evidence across momentum, volume, and trend analysis is overwhelmingly bullish. Nine out of ten technical dimensions are scoring in the bullish zone, with only overhead resistance showing weakness. RSI is deep in overbought territory, MACD histogram is expanding above its signal line, Bollinger Bands are compressed but with price in the upper band, and on-balance volume is rising. This convergence of bullish signals suggests accumulation is ongoing and the next move is more likely to be up than down.
RSI: Overbought but not yet exhausted
The RSI at 77.6 is well above the 70 overbought threshold, signaling aggressive buying pressure. However, overbought readings on daily timeframes do not automatically mean a reversal is imminent, especially when they are supported by rising volume and uptrending moving averages. The RSI's sustained elevation above 70 tells us that buyers are in control and momentum has not yet rolled over.
Score: 8.5 / 10 | Bullish
Moving Averages: All four aligned in bullish formation
Price at $87.56 sits above the EMA 20 at $77.40, the EMA 50 at $76.39, and the EMA 100 at $77.36, creating a textbook bullish stack. The only concern is the EMA 200 at $81.25, which remains above the shorter-term averages, indicating a slight macro headwind. However, price is still $6.31 above the 200-day line, confirming that the dominant long-term trend is intact and the bull case remains valid.
Score: 9 / 10 | Bullish
Bollinger Bands: Price riding the upper band
SOL is trading in the upper third of the Bollinger Band range, with the upper band at $83.52, mid-band at $76.05, and lower band at $68.58. The price's proximity to $83.52 suggests volatility is compressed but directional bias remains up. The bands are relatively narrow, which can precede either a sharp move or consolidation, and the RSI overbought condition alongside price near the upper band raises the question of whether a pullback to the mid-band at $76.05 might occur first.
Score: 9 / 10 | Bullish
Fibonacci Retracements: Price in the upper half of the advance
Measuring from the swing low of $60.14 to the swing high of $96.00, SOL is currently positioned between the 0.618 Fibonacci level at $82.30 and the 0.786 level at $88.33. This upper-middle zone of the retracement grid is constructive and suggests price has already reclaimed most of the move from bottom to top. The next Fibonacci resistance above price is the 0.786 level at $88.33, which aligns closely with the $88.55 resistance and suggests a potential target in the $88 to $89 zone.
Score: 8 / 10 | Bullish
Support Levels: Multiple cushions below
Four support levels are stacked beneath the current price: $86.99 is just $0.57 away, $83.20 is $4.36 away, $80.18 is $7.38 away, and $76.68 is $10.88 away. The nearest support at $86.99 is tight, which means any pullback would quickly find a floor. The spacing of these levels and the proximity of the first two suggest that even if profit-taking occurs, price has multiple stepping stones on the way down, reducing the risk of a sharp collapse.
Score: 7.5 / 10 | Bullish
Resistance: Dense overhead supply blocking the way
Three resistance zones are clustered above: $88.55, $92.33, and $98.03. The first resistance at $88.55 is just $0.99 away and will be tested imminently if momentum continues. Beyond that, $92.33 is $4.77 away and $98.03 is $10.47 away, leading back to the recent swing high of $96.00. This dense cluster of supply overhead is the main headwind to further upside and explains why the resistance score is a low 3 out of 10: the bull has to work hard to break through multiple layers.
Score: 3 / 10 | Bearish
Trendline: Descending line being tested from below
The dominant trendline is descending, currently at $76.00, and price at $87.56 is well above it. This means SOL has broken above the longer-term downtrend and is now trading in a zone of recovery. The fact that price is $11.56 above the trendline suggests the breakout has room to run, though the descending nature of the line reminds us that the macro environment was recently bearish. A move back below the trendline would be a warning sign that the recovery may be exhausted.
Score: 6.5 / 10 | Bullish
MACD: Histogram expanding and line above signal
The MACD line at 1.767319 is well above the signal line at 0.526082, with a histogram of 1.241237 that is positive and growing. This configuration indicates that momentum is accelerating to the upside and the fast line (MACD) is pulling decisively away from the slow line (signal). This is a textbook bullish MACD setup and suggests that buying pressure is intensifying rather than waning, reinforcing the overall bullish case.
Score: 8.5 / 10 | Bullish
On-Balance Volume: Rising OBV confirms accumulation
The OBV trend is rising, which is a powerful confirmation that volume is flowing into the asset on up days more than out on down days. Rising OBV alongside a rising price is a hallmark of healthy, sustainable uptrends driven by real accumulation. This signal validates the price move and suggests that the rally is backed by genuine demand rather than being a thin, weak bounce.
Score: 7 / 10 | Bullish
Chart Patterns: No clear pattern limits the upside
There is no clear chart pattern currently forming, which means price is not constrained by a measured target from a traditional pattern like a head-and-shoulders, triangle, or flag. While the absence of a pattern removes the ability to forecast a specific target, it also removes overhead resistance that would come from a pattern completion level. In the context of rising momentum and aligned moving averages, the absence of a defined pattern actually leaves more room for an exploratory move higher.
Score: 5 / 10 | Neutral
Indicator | Reading | Score / 10 |
|---|---|---|
RSI (14) | Overbought at 77.6, sustained momentum bullish | 8.5 |
EMAs (20 / 50 / 100 / 200) | All four aligned, price above all short-term, above 200-day too | 9 |
Bollinger Bands | Price in upper band, bands compressed, volatility setup forming | 9 |
Fibonacci | Price between 0.618 and 0.786 levels, upper half of advance | 8 |
Support | Four levels stacked, nearest at $86.99 provides cushion | 7.5 |
Resistance | Three dense levels overhead, $88.55 first hurdle very close | 3 |
Trendline | Descending line broken, price $11.56 above, recovery confirmed | 6.5 |
MACD | Line above signal, histogram expanding, momentum accelerating | 8.5 |
On-Balance Volume | Rising OBV confirms real accumulation, not fake rally | 7 |
Chart Patterns | No clear pattern, removes constraint but also removes clarity | 5 |
Cumulative Average | BULLISH bias with multiple confirmations converging | 7.2 |
I'm going long here because the cumulative score of 7.2 out of 10 reflects genuine strength across momentum, trend, and volume. Nine of my ten technical dimensions are flashing green, and the only red flag is the tight resistance overhead. I'm betting that price will test and break through the $88.55 resistance on its way to the $92 to $93 zone, and I'm willing to risk a break below $86.99 to play this setup.
My entry zone | $87.00 – $88.00 |
My stop loss | $86.50 (break below the nearest support at $86.99 with daily close) |
My target 1 | $88.55: first overhead resistance |
My target 2 | $92.33: second resistance level |
My target 3 | $96.00: recent swing high |
Risk : Reward | 1 : 0.05 (T1) / 1 : 6.45 (T2) / 1 : 9.50 (T3) |
Position | Long |
I would exit this long trade immediately if SOL closes below $86.99 on the daily candle with volume, because that would break the nearest support and signal that the bullish momentum is exhausted. My thesis is wrong if price rolls over from the current levels without testing the $88.55 resistance and instead falls back to the $80 to $83 zone, where I would need to reassess the macro trend. I am also watching the $76.00 descending trendline as a longer-term invalidation point, because a close below that level would suggest the recovery has failed and the downtrend has resumed.
Disclaimer: This article is produced for informational and educational purposes only and does not constitute financial or investment advice. Cryptocurrency markets are highly volatile and carry significant risk. Always conduct your own research and consult a qualified financial adviser before making any trading decisions.
This crypto just flashed all the right signals. Is this your entry point?
 NEAR
NEAR
A small altcoin is showing all the signs of a major breakout. Here's what the numbers say.
This oracle token is breaking higher. Should you buy in before the next move?
 LINK
LINK
