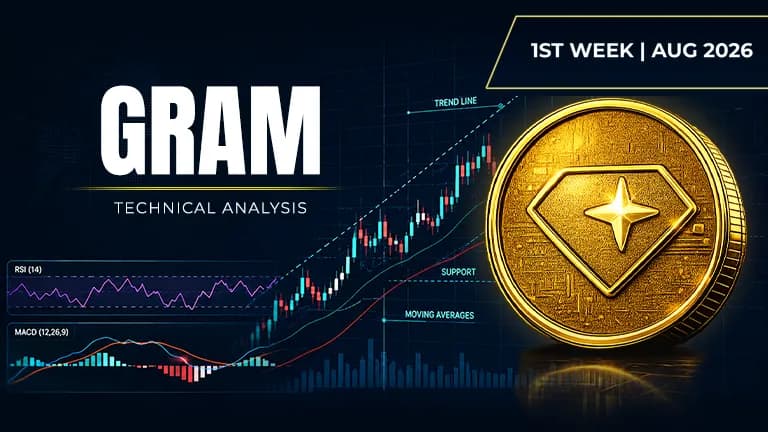
GRAM is flashing a major warning sign: should you be worried?
Asset | GRAM (GRAM/USDT) |
Price at Analysis | $1.38 |
Timeframe | Daily candle |
Date | August 4, 2026 |
Bias | BEARISH |
My Trade | Short: weakness into support |
Cumulative Score | 3.8 / 10 |
200-day EMA | $1.53, price is below |
Bias Invalidation | Close above $1.52 on daily: if price reclaims and holds above resistance, thesis flips |
GRAM is trading at $1.38 on August 4, 2026, and sitting well below nearly every major moving average. The token has fallen from a swing high of $2.91 and is now bumping against support at $1.37, just $0.01 below current price. The overall market structure is deeply bearish: price is underwater relative to the 200-day EMA at $1.53, and heavy resistance looms immediately overhead between $1.39 and $1.52.
The weight of evidence across ten indicators screams weakness. Moving averages are stacked bearishly against price, momentum is fading into oversold territory on the RSI, and on-balance volume is falling: meaning sellers are in charge. MACD is in negative territory with a shrinking histogram, and Bollinger Bands are pinched tightly, offering little upside room. This is not the setup of a token about to rally. This is the setup of an asset running out of buyers.
RSI: Oversold but not yet bouncing
The RSI is at 37.5, which is below the 50 midpoint and deep in the lower half of the range. This signals momentum is weak and price is selling more than it is buying. An RSI this low can sometimes set up a bounce, but the histogram of momentum (MACD) is still negative, suggesting the selling pressure has not yet exhausted itself. I am watching to see if RSI dips below 30, which would be a true oversold extreme: a potential capitulation zone.
Score: 4 / 10 | Bearish
Moving Averages: All barriers pointing down
Price at $1.38 is now trading below all four major EMAs: the 20-day at $1.46, the 50-day at $1.55, the 100-day at $1.58, and the 200-day at $1.53. When price is beneath all moving averages, especially the 200-day, the macro trend is bearish. The 200-day EMA sits at $1.53 and acts as a ceiling: every attempt to rally will face friction at this level. This is a classic bearish alignment, and it tells me the path of least resistance is lower.
Score: 2.5 / 10 | Bearish
Bollinger Bands: Squeezed and ready to flush
Price is trading between the Bollinger Band lower of $1.37 and the midline at $1.46, very close to the lower band. The upper band sits at $1.55, which is $0.17 above current price. This narrow configuration suggests volatility is compressed, and historically tight bands often precede sharp directional moves. Given the bearish momentum across all other indicators, my bias is that the next big move will be downward, toward the lower band or below it.
Score: 3 / 10 | Bearish
Fibonacci Retracements: Caught between key levels
Price has fallen from the swing high of $2.91 to $1.38, and is now trading between the 0.236 level at $1.67 and the 0.382 level at $1.91. More significantly, price is below all major Fibonacci resistance levels, meaning buyers need to climb multiple structural barriers to reclaim the upper zone. The next Fib support below price is the 0.236 at $1.67, but that is above current levels, so there is no Fib cushion beneath us until we reset the swing.
Score: 3 / 10 | Bearish
Support Levels: Close but not comfortable
GRAM has visible support at $1.37, just $0.01 below the current price, followed by stronger support at $1.29, $1.25, and $1.20. The proximity of the first support at $1.37 is the only thing keeping this from a full rout. If price closes below $1.37, there is meaningful air until the next level at $1.29. The fact that we are this close to the first support suggests we may test it very soon, which is why support is the one bright spot on this scorecard.
Score: 7.5 / 10 | Bullish
Resistance: Heavy overhead supply
Resistance is stacked tightly above current price at $1.39, $1.43, $1.46, and $1.52. Every one of these levels will require effort to break through, and combined they form a significant zone of overhead supply. The $1.46 level is also the 20-day EMA, which adds confluence. The fact that resistance is so densely packed tells me that bounces will be sold into, and there is little room to breathe on rallies. Sellers are clearly positioned to defend this entire zone.
Score: 3 / 10 | Bearish
Trendline: Descending and in control
The dominant trendline is descending, currently sitting at $1.46. Price at $1.38 is below this trendline, confirming we are still within the downtrend. A trendline is not just a line on a chart; it is a boundary that the market respects. The fact that we are below it and that all moving averages are aligned downward tells me the structure remains firmly bearish. Breaking above $1.46 would be the first step toward invalidating the downtrend, but we are not there yet.
Score: 3 / 10 | Bearish
MACD: Negative momentum with no reversal yet
MACD is in negative territory with the line at -0.051148 and the signal at -0.049323. The histogram is -0.0018, which is slightly negative but very small, suggesting momentum is slow and weak. The line and signal are both below zero, confirming that selling pressure is the dominant force. However, the histogram is not expanding downward sharply, which means the selling is not accelerating. This could be a warning that a bounce is coming, but not yet.
Score: 4 / 10 | Bearish
On-Balance Volume: Sellers are dumping
On-balance volume is falling, which tells me that volume on down days is outpacing volume on up days. This is a confirmation that selling is in control and that rallies are not backed by buyer conviction. When OBV is falling alongside declining price, it signals distribution: holders are exiting, not accumulating. This is one of the most concerning signals on the chart because it shows that even small rallies are not being bought into with real volume.
Score: 3 / 10 | Bearish
Chart Patterns: No Clear Pattern
There is no recognizable chart pattern at present, which means I cannot use a measured target like a head and shoulders or a flag. However, the absence of a defined pattern does not mean there is no direction. The overall price action is showing a grinding decline from the $2.91 high toward support. Without a pattern, I rely more heavily on support and resistance levels and the alignment of moving averages, both of which are screaming lower.
Score: 5 / 10 | Neutral
Indicator | Reading | Score / 10 |
|---|---|---|
RSI (14) | Below 50, weak momentum | 4 |
EMAs (20 / 50 / 100 / 200) | All above price, strong bearish stack | 2.5 |
Bollinger Bands | Squeezed near lower band | 3 |
Fibonacci | Price below all resistance levels | 3 |
Support | Strong zone at $1.37 and below | 7.5 |
Resistance | Densely packed overhead | 3 |
Trendline | Descending, price below it | 3 |
MACD | Negative line and signal | 4 |
On-Balance Volume | Falling, sellers in control | 3 |
Chart Patterns | No clear pattern visible | 5 |
Cumulative Average | BEARISH bias: I'm going short | 3.8 |
I'm going short on GRAM because the cumulative score of 3.8 out of 10 tells me there is far more downside than upside risk. Price is pinned against support at $1.37 with all moving averages pointing downward, MACD in negative territory, and on-balance volume rolling over. My entry zone is the current price action between $1.38 and $1.39, right into the initial resistance, and I'm looking for a breakdown toward the support levels at $1.29 and $1.20. The risk is tight because support is close; the reward is significant because there are multiple levels below where I can bank profits.
My entry zone | $1.38 – $1.39 |
My stop loss | $1.52 (above all resistance and the 20-day EMA) |
My target 1 | $1.29: swing low support |
My target 2 | $1.25: secondary support zone |
My target 3 | $1.20: extended support |
Risk : Reward | 1 : 1.6 (T1) / 1 : 2.4 (T2) |
Position | Short / leveraged short |
I would exit my short position if price closes above $1.52 on the daily, reclaiming the cluster of resistance and the 20-day EMA. If that happens, it would mean buyers are returning with enough force to break through the densest part of the overhead supply, and the move above the trendline at $1.46 would signal that the downtrend is losing steam. At that point, my thesis would be wrong, and I would reverse to flat or pivot to a long. Anything below that level is still my game to play, so I will be patient and let support either hold or break cleanly.
Disclaimer: This article is produced for informational and educational purposes only and does not constitute financial or investment advice. Cryptocurrency markets are highly volatile and carry significant risk. Always conduct your own research and consult a qualified financial adviser before making any trading decisions.
Ripple is trapped between bulls and bears-here's what happens next.
 XRP
XRP
Quant's treading water between bulls and bears. Here's what traders should know.
Cardano sits at a crossroads with signals pointing every which way.
 ADA
ADA
