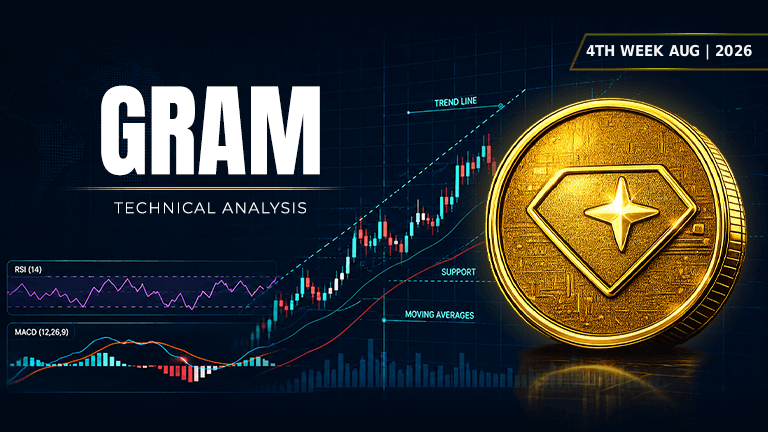
GRAM is balanced on a knife edge with no clear direction emerging this week.
Asset | GRAM (GRAM/USDT) |
Price at Analysis | $1.42 |
Timeframe | Daily candle |
Date | August 26, 2026 |
Bias | NEUTRAL |
My Trade | Neutral: waiting for directional confirmation |
Cumulative Score | 5.4 / 10 |
200-day EMA | $1.52, price is below |
Bias Invalidation | Break above $1.46 or below $1.30 with volume would flip the setup |
GRAM is trading at $1.42 on August 26, 2026, sitting nearly 10 cents below its 200-day moving average at $1.52 and more than 37% below its swing high of $2.28. The market structure shows price caught between competing forces: support clusters are tight and strong nearby, but overhead resistance is stacked like a brick wall. The overall mood is indecision, with momentum indicators sending conflicting signals and volume trending lower even as price attempts to hold ground.
The weight of evidence across all 10 technical indicators points firmly to neutral territory. MACD is the bright spot, showing positive histogram expansion and a bullish cross setup that suggests some upside energy is building. However, this is undermined by falling on-balance volume, a descending trendline, and a crowded resistance band that caps any rally attempt. Moving averages are bearishly aligned with price below all four key levels, while support levels just below provide a backstop that keeps the downside contained. This is a coin that is neither breaking down nor breaking out, holding investors in limbo.
RSI: Right at equilibrium, neither hot nor cold
The RSI sits at 50.9, exactly at the midpoint between overbought and oversold territory. This reading tells us there is no excess in either direction; momentum is perfectly balanced. For GRAM to make a decisive move in either direction, RSI needs to decisively break above 70 or below 30, and right now it lacks the oomph to do either.
Score: 6 / 10 | Bullish
Moving Averages: Price trapped below all major levels
All four key EMAs are stacked above current price: the 20-day EMA sits at $1.41 (just below), the 50-day at $1.45, the 100-day at $1.50, and the 200-day at $1.52. The fact that price is below all of them, even the shorter-term 20-day, signals that the macro trend remains downward and the bears still have structural control. For a true trend reversal, GRAM would need to reclaim and close above the 200-day EMA at $1.52, which would represent a shift in longer-term character.
Score: 4 / 10 | Bearish
Bollinger Bands: Price near the centerline
GRAM is trading near the midline of the Bollinger Bands at $1.38, with the upper band at $1.49 and the lower band at $1.26. Being near the middle suggests volatility is contracting and price is in a consolidation zone rather than trending strongly in either direction. The bands are relatively wide, indicating moderate volatility, but price's position in the center reflects the indecision in the market. A breakout above $1.49 would be bullish, while a drop below $1.30 would test the lower band and signal renewed weakness.
Score: 6 / 10 | Bullish
Fibonacci: Price remains in the lower retracement zone
From the swing low of $1.30 to the swing high of $2.28, GRAM is currently trading between the 0.236 retracement level at $1.53 and below it. At $1.42, price is trading below the 0.236 Fib level, which is the weakest retracement zone and signals that bulls have not yet reclaimed any meaningful portion of the prior move down. For a bullish setup to take shape, price would need to break above $1.53 and work toward the 0.382 level at $1.67, which would indicate real recovery momentum is building.
Score: 3 / 10 | Bearish
Support Levels: Multiple buffers holding the line
GRAM has a strong cluster of support levels very close to current price: $1.41 is just below, $1.37 is a few pennies deeper, $1.30 marks the recent swing low, and $1.26 sits at the lower Bollinger Band. The proximity of these supports means any selloff will meet buying pressure almost immediately, which reduces the risk of a sharp crash and provides traders with clear risk management zones. The fact that $1.41 (nearly touching price) and $1.37 are so close suggests this area is well-defended by buyers.
Score: 7.5 / 10 | Bullish
Resistance: Heavy overhead supply blocking the path
Resistance is stacked thickly above: $1.43 is just 1 cent away, $1.46 is a few cents higher, $1.52 aligns with the 200-day EMA, and $1.56 is the next major barrier. This cluster of resistance zones means that any rally attempt will run into selling pressure repeatedly, making it difficult to build momentum on an advance. The fact that resistance is so concentrated and numerous suggests there is real supply waiting to sell into any strength, which puts the onus on buyers to overcome significant headwinds.
Score: 3 / 10 | Bearish
Trendline: Descending slope keeps sellers in control
The dominant trendline is descending and sits at $1.36, which is below current price at $1.42. Because price is above the descending trendline, GRAM has not yet violated it, but the slope itself remains bearish and represents the path of least resistance downward. If the trendline is respected and holds, it could provide a floor, but if it breaks and closes below $1.36, the structural bearish trend would be confirmed and a new leg lower could unfold.
Score: 6.5 / 10 | Bullish
MACD: Momentum is coiling for a breakout move
The MACD line at 0.004132 is above the signal line at -0.012249, creating a bullish crossover setup, and the histogram at 0.016381 is positive and expanding. This is the strongest technical signal in the chart and suggests that momentum energy is building beneath the surface and preparing to push GRAM higher. MACD crossovers often precede price breakouts, so if this positive histogram continues to expand over the next few days, it would support a move toward the resistance zone at $1.46 or higher.
Score: 8.5 / 10 | Bullish
On-Balance Volume: Falling trend warns of seller involvement
On-balance volume is falling, which means that selling volume is outweighing buying volume over the recent period. This is a red flag because it suggests that although price is holding near these levels, accumulation is not happening aggressively; instead, distribution is occurring. For a bullish move to be trustworthy, OBV needs to reverse and start rising again, confirming that buyers are stepping in with conviction. Right now, the falling OBV diverges from what we want to see and creates doubt about the sustainability of any rally.
Score: 3 / 10 | Bearish
Chart Patterns: Double bottom sets up a potential bounce
A double bottom pattern is forming, which is a classic reversal signal that suggests price has found a floor and is ready to bounce higher. Double bottoms typically measure their target by taking the height of the pattern (the distance from the lows to the neckline) and adding it to the breakout level. If this pattern is valid and price breaks above the neckline near $1.46 to $1.50, it could propel GRAM toward $1.67 or higher. However, the pattern is not yet confirmed until price closes decisively above the neckline with volume support.
Score: 6.5 / 10 | Bullish
Indicator | Reading | Score / 10 |
|---|---|---|
RSI (14) | Neutral at 50.9, no excess in either direction | 6 |
EMAs (20 / 50 / 100 / 200) | Price below all four, bearish alignment intact | 4 |
Bollinger Bands | Trading near midline, volatility is contracting | 6 |
Fibonacci | Below 0.236 retracement, weak recovery structure | 3 |
Support | Four levels clustered $1.26 to $1.41, well defended | 7.5 |
Resistance | Heavy overhead at $1.43, $1.46, $1.52, $1.56 | 3 |
Trendline | Descending but price above at $1.36, still valid | 6.5 |
MACD | Bullish crossover with expanding positive histogram | 8.5 |
On-Balance Volume | Falling trend, sellers in control of tape | 3 |
Chart Patterns | Double bottom forming, reversal signal in place | 6.5 |
Cumulative Average | NEUTRAL bias, staying on sidelines until direction clears | 5.4 |
I'm staying neutral on GRAM because the cumulative score of 5.4 out of 10 tells me the setup is too mixed to commit to either direction. MACD is flashing a bullish signal with its positive crossover, and support is strong enough to prevent a crash, but falling volume and stacked resistance overhead mean any rally is going to be a grind. I'm not shorting because the double bottom pattern and nearby support at $1.41 and $1.37 are too strong. I'm not going long because price needs to clear the resistance gauntlet at $1.43, $1.46, $1.52, and $1.56 in sequence. Instead, I'm waiting for price to break decisively out of this range in either direction and for volume to confirm which way the market actually wants to go.
My entry zone | $1.38 – $1.44 (if setup clarifies upward) or $1.40 – $1.42 (if bearish break) |
My stop loss | $1.30 (support breaks down and double bottom fails) |
My target 1 | $1.46: first resistance zone |
My target 2 | $1.52: 200-day EMA and second resistance |
My target 3 | $1.67: Fibonacci 0.382 retracement from double bottom |
Risk : Reward | 1 : 0.8 (T1) / 1 : 1.6 (T2) |
Position | Neutral, standing aside |
I would exit or flip my position if GRAM breaks decisively above $1.46 with expanding volume, at which point I would consider a long entry toward the $1.52 and $1.67 targets. Conversely, my thesis is wrong if price closes below the support cluster at $1.37 and cannot hold the descending trendline at $1.36, which would signal a breakdown and force me to flip bearish. The double bottom would be invalidated below $1.30, and if that level breaks with conviction, I would short GRAM targeting $1.26 and below. Until one of these scenarios unfolds with clear conviction and volume, I'm staying on the sidelines and letting the market prove its next move to me.
Disclaimer: This article is produced for informational and educational purposes only and does not constitute financial or investment advice. Cryptocurrency markets are highly volatile and carry significant risk. Always conduct your own research and consult a qualified financial adviser before making any trading decisions.
This altcoin is flashing green signals across nearly every indicator, but one major warning sign could derail the upside.
 STG
STG
A small altcoin is staging a quiet rally. Here's why traders are watching closely.
 ZBCN
ZBCN-768x432.png&w=3840&q=75&dpl=dpl_2a1LjK7J47ZhhwjhB7eFPuxwceT3)
A small-cap token just flipped bullish. Most traders haven't noticed yet.
 INIT
INIT
