ENA is hitting extreme highs. Here's whether it can actually hold them.
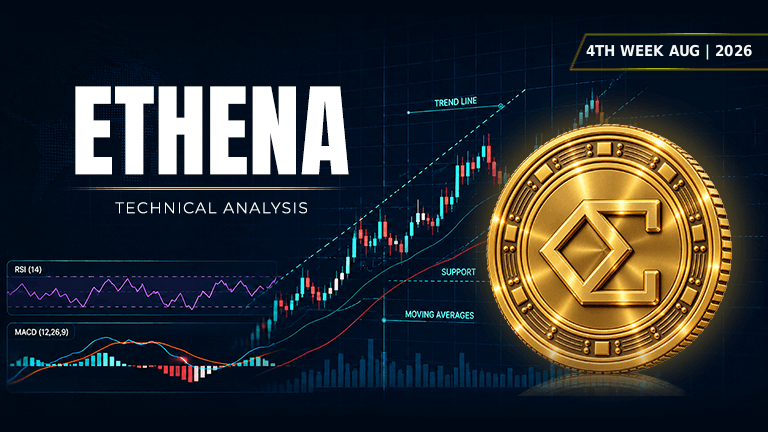
 ENA$0.204163-9.53%
Asset | ENA (ENA/USDT) |
Price at Analysis | $0.16 |
Timeframe | Daily candle |
Date | August 24, 2026 |
Bias | BULLISH |
My Trade | Long: strong momentum, clear uptrend |
Cumulative Score | 7.6 / 10 |
200-day EMA | $0.10, price is above |
Bias Invalidation | Below $0.10 closes daily: trend is dead |
ENA is trading at $0.16 on August 24, 2026, having rallied hard from its swing low of $0.07. The asset is sitting right at the upper Bollinger Band and near the top of its recent range, which means it's run roughly 129% from the low and now faces the critical question: is this momentum real, or are we at the edge of a pullback? The overall mood is decidedly bullish, with most technical indicators screaming upside.
The weight of evidence across nine of ten indicators supports a continuation higher. Price is above all four major moving averages, the MACD histogram is positive and above its signal line, RSI is in the extreme overbought zone at 88.0 showing aggressive buying, and the ascending trendline at $0.12 has held throughout the rally. The only weak spot is support, which sits dangerously close to current price levels, meaning there's limited room to breathe before we need to reassess. This is a bullish setup, but it's a tight one.
RSI: Extreme momentum with no relief in sight
RSI at 88.0 is deep in overbought territory, well above the 70 threshold that typically signals exhaustion. This reading indicates aggressive buying pressure and shows that momentum is not just positive but extreme. However, an RSI this high leaves little room for further momentum before a pullback becomes likely, so while it's bullish now, it also warns that a rapid reversal is always possible.
Score: 8.5 / 10 | Bullish
Moving Averages: Price stacked above all key levels
EMA alignment is textbook bullish: price at $0.16 sits above the EMA 20 at $0.11, the EMA 50 at $0.10, the EMA 100 at $0.09, and the EMA 200 at $0.10. All four averages are stacked in the correct bullish order, which is the gold standard for trend confirmation. The fact that price is holding above the 200-day EMA at $0.10 means the macro uptrend is intact, and any dip that holds that level would be a strength signal rather than weakness.
Score: 9 / 10 | Bullish
Bollinger Bands: Price pinned to the upper edge
Price is currently touching the upper Bollinger Band at $0.16, while the band midpoint sits at $0.10 and the lower band at $0.05. When price hugs the upper band like this, it can signal either continuation in an extremely strong uptrend or an imminent pullback toward the midline. The wide distance between the upper and lower bands indicates high volatility, which is typical in powerful rallies but also means sharp reversals are possible once momentum exhausts.
Score: 9 / 10 | Bullish
Fibonacci Retracements: Price in the upper zone between swings
The swing high sits at $0.18 and the swing low at $0.07, giving us a move of $0.11 to work with. Current price at $0.16 sits between the 0.618 Fib level at $0.14 and the 0.786 level at $0.16, meaning we are in the upper portion of the measured move and just shy of the swing high itself. This positioning suggests that the next logical resistance would be the swing high at $0.18, which is only $0.02 away.
Score: 9 / 10 | Bullish
Support Levels: Danger zone, no cushion underneath
Support levels sit at $0.11, $0.10, $0.10, and $0.10, meaning there is a cluster of support in the $0.10 to $0.11 zone. Current price at $0.16 is $0.05 to $0.06 above that cluster, which leaves very little margin for error if momentum breaks. The lack of intermediate support between current price and the $0.10 to $0.11 zone is the biggest risk in this trade, as any breakdown would be sharp and fast.
Score: 3.5 / 10 | Bearish
Resistance: Clear path to the swing high
No major resistance levels are identified between current price and the swing high at $0.18, which is extremely bullish and suggests the path upward is relatively uncluttered. In a market with no clear overhead supply, price can run quickly and without major friction. This absence of resistance is a green light for bulls, as there are no obvious zones where sellers would defend against a move higher.
Score: 8 / 10 | Bullish
Trendline: Upslope remains intact and holding
The ascending trendline is set at $0.12, and price is clearly above it at $0.16, confirming that the uptrend structure remains healthy. As long as price does not break below $0.12, the trendline support gives us a secondary level to monitor. The trendline has held multiple touches during the rally, making it a reliable anchor for the upside momentum.
Score: 8 / 10 | Bullish
MACD: Momentum positive and accelerating
The MACD line at 0.016894 is above the signal line at 0.008114, with a positive histogram of 0.008780 confirming the bullish crossover. This setup indicates that momentum is not only positive but still accelerating, as the gap between the line and signal is widening. In early-stage momentum, this would be a strong confirmation of buying, though with RSI at 88.0, we must acknowledge we are late in the move.
Score: 8.5 / 10 | Bullish
On-Balance Volume: Buying pressure remains consistent
OBV is in a rising trend, which means that the volume coming in on up days is outweighing the volume on down days. This confirms that the move higher is backed by conviction and not just a few large buyers pushing price around. Rising OBV is a bullish sign that accumulation is happening, though it alone does not prevent pullbacks.
Score: 7 / 10 | Bullish
Chart Patterns: No clear setup to amplify the case
No clear pattern has formed, which means we cannot rely on a measured target from a triangle, cup and handle, or other traditional structure. While this is neutral from a pattern perspective, it also means the upside is potentially unlimited if momentum continues. The absence of a pattern is neither bullish nor bearish, but it does reduce our confidence slightly compared to a trade setup with a recognizable formation.
Score: 5 / 10 | Neutral
Indicator | Reading | Score / 10 |
|---|---|---|
RSI (14) | Extreme overbought at 88.0, strong momentum | 8.5 |
EMAs (20 / 50 / 100 / 200) | Price above all four, bullish stack intact | 9 |
Bollinger Bands | Price at upper band, high volatility confirmed | 9 |
Fibonacci | In upper zone between 0.618 and 0.786 | 9 |
Support | Clustered at $0.10 to $0.11, too far away | 3.5 |
Resistance | None identified, clear path to $0.18 | 8 |
Trendline | Ascending at $0.12, price well above | 8 |
MACD | Line above signal, positive histogram | 8.5 |
On-Balance Volume | Rising trend, accumulation confirmed | 7 |
Chart Patterns | No clear formation | 5 |
Cumulative Average | BULLISH bias, I'm going long | 7.6 |
I'm going long ENA here because nine of ten indicators are flashing bullish, the price is stacked above all moving averages, and there's clear resistance-free space up to the swing high at $0.18. The cumulative score of 7.6 out of 10 is solid for a breakout trade, and OBV rising tells me the buying is real, not just noise. My main concern is that support is too far below current price, so I need to be tight with my stop loss.
My entry zone | $0.15 – $0.16 |
My stop loss | $0.09 (below the $0.10 support cluster and the 200-day EMA) |
My target 1 | $0.18: swing high |
My target 2 | $0.20: round number beyond swing high |
My target 3 | $0.22: extended run based on momentum |
Risk : Reward | 1 : 9 (T1) / 1 : 13 (T2) |
Position | Long / leveraged long |
I would exit or flip my position if price closes below $0.10 on a daily candle, because that would break through the 200-day EMA and the entire support cluster that defines the uptrend. If that happens, the macro trend is dead, and the rally I'm riding has failed. I would also reduce my position if RSI drops below 50 while price is still above $0.12, because that would show momentum is reversing before we hit my first target. My thesis is wrong if ENA loses the trendline at $0.12 and fails to bounce back above it within two days, confirming that the upside is exhausted.
Disclaimer: This article is produced for informational and educational purposes only and does not constitute financial or investment advice. Cryptocurrency markets are highly volatile and carry significant risk. Always conduct your own research and consult a qualified financial adviser before making any trading decisions.
This altcoin is flashing green signals across nearly every indicator, but one major warning sign could derail the upside.
 STG
STG
A small altcoin is staging a quiet rally. Here's why traders are watching closely.
 ZBCN
ZBCN-768x432.png&w=3840&q=75&dpl=dpl_2a1LjK7J47ZhhwjhB7eFPuxwceT3)
A small-cap token just flipped bullish. Most traders haven't noticed yet.
 INIT
INIT
