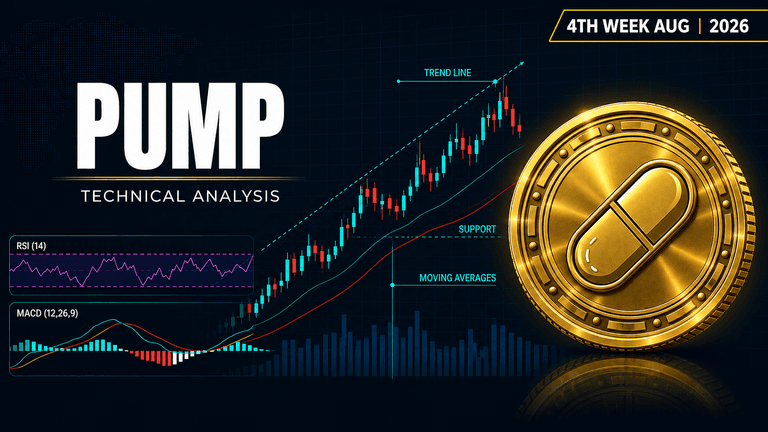
PUMP is at a critical crossroads where one move could decide everything this week.
 PUMP$0.00644+1.44%
Asset | PUMP (PUMP/USDT) |
Price at Analysis | $0.004844 |
Timeframe | Daily candle |
Date | August 26, 2026 |
Bias | BULLISH |
My Trade | Long: momentum and alignment |
Cumulative Score | 7.3 / 10 |
200-day EMA | $0.001957, price is above |
Bias Invalidation | $0.004154: close below trendline support |
PUMP is trading at $0.004844 on the daily timeframe, up significantly from its 200-day EMA of $0.001957. The coin sits just $0.000597 below the swing high of $0.005441, positioning it near the upper end of its recent range. The overall momentum is decidedly bullish, with price well above all major moving averages and supported by rising volume. This is a market showing clear strength, but also one that has moved fast and now faces a critical resistance zone.
Nine out of ten technical indicators are pointing in the same direction: up. The moving averages are stacked perfectly bullish, MACD is positive with the histogram expanding, RSI sits in the momentum zone at 73.1, and Fibonacci levels suggest price is in a zone of structural support. However, the weak support score of 3.5 reveals a dangerous reality: if this move reverses, there is very little floor beneath until we drop significantly lower. The weight of evidence is solidly bullish, but the lack of strong support underneath is the only red flag in an otherwise green setup.
RSI: Strong momentum, but entering overbought territory
The RSI is reading 73.1, well above 50 and into the zone where momentum is considered extended. This is not yet a full overbought extreme (which typically starts at 80), but it signals that buying pressure is intense and the move has been sustained. At this level, RSI is confirming the bullish bias but also warning that another large push higher would require fresh catalysts. The lack of a bearish divergence means momentum is still clean and supportive.
Score: 8 / 10 | Bullish
Moving Averages: A textbook bullish alignment
The EMA stack is picture-perfect for a bullish trend. Price at $0.004844 sits well above the 20-EMA of $0.003627, the 50-EMA of $0.002802, the 100-EMA of $0.002342, and the 200-EMA of $0.001957. All four moving averages are in ascending order and sloping upward, confirming that the macro trend is decisively higher. The distance from price to the 200-EMA represents a 147% gain, indicating that this is not a bounce but a real structure change. This is the single strongest technical confirmation of the bullish bias.
Score: 9 / 10 | Bullish
Bollinger Bands: Price riding the upper band
Price is positioned between the midline at $0.003391 and the upper band at $0.005275, trading in the upper half of the channel. This placement indicates volatility is expanding upward and price is in an aggressive phase. The upper band at $0.005275 sits just $0.000431 above current price, suggesting that the Bollinger Bands see $0.005275 as the next natural resistance level. When price trades in the upper half of the bands, it typically signals continued strength, though it also means mean reversion becomes a risk if momentum fades.
Score: 7.5 / 10 | Bullish
Fibonacci Retracements: Price in a strong structural zone
Measuring from the swing low of $0.001152 to the swing high of $0.005441, price at $0.004844 is positioned just above the 0.786 Fibonacci level of $0.004523. This is a powerful zone because it represents the point where most of the upside has already been captured, and historically, coins either explode through this level toward the high or they pull back. The fact that price is just barely above 0.786 means we are at an inflection point: a break above $0.005275 would complete a move to the 100% level, while a break below $0.004523 would signal a pullback is underway. Fibonacci is strongly bullish on the setup, but the precision required to navigate this zone makes it a critical watch.
Score: 9 / 10 | Bullish
Support Levels: A dangerous lack of nearby floor
The nearest support lies at $0.002642, which is $0.002202 below current price. This is an enormous gap, meaning that if price breaks down, there is almost no cushion before a sharp drop. The other support zones at $0.002242, $0.001977, and $0.001925 are even further away. The score of 3.5 reflects this reality: support is weak and distant, which means that a failed breakout could result in a waterfall move lower. This is the structural weakness in the current setup and explains why risk management must be tight on any short positions taken at these levels.
Score: 3.5 / 10 | Bearish
Resistance: The $0.005441 level blocks the way up
Resistance is concentrated at the swing high of $0.005441, which represents the recent peak. This is a meaningful overhead obstacle because it marks the point where buyers have exhausted themselves before. Price needs to break and hold above $0.005441 to prove that the uptrend has more runway. A close above this level would negate the immediate resistance and open the path toward $0.005500 and beyond. Until that break happens, $0.005441 remains the bull's target and the bear's defensive line.
Score: 7 / 10 | Bullish
Trendline: Ascending trend intact and supported
The ascending trendline is sitting at $0.004154, well below current price of $0.004844. This means price is solidly above the trend support, which is a bullish signal. The fact that the trendline is rising tells us that higher lows are being established, confirming the uptrend structure. If price were to close below the trendline at $0.004154, it would be the first break of the trend, and that would be the signal that the structure has changed. For now, the trendline is supporting the bull case and offering a clear invalidation level.
Score: 8 / 10 | Bullish
MACD: Histogram expanding and momentum building
The MACD line is at 0.000692, above the signal line at 0.000533, with the histogram at 0.000160 and expanding. This is a textbook bullish MACD setup: the line is above the signal, the histogram is positive, and the histogram is growing, indicating that momentum is accelerating. MACD has not yet begun to roll over or show signs of fatigue, which means the bulls still have fuel. This is one of the cleanest bullish confirmations on the chart and suggests that further upside is still in play.
Score: 8.5 / 10 | Bullish
On-Balance Volume: Buyers are accumulating steadily
OBV is in a rising trend, which confirms that volume is supporting the price advance. When price moves up on rising volume, it signals that new money is flowing in, not just existing holders recycling coins. This lack of divergence between price and volume is a positive sign for the durability of the move. Rising OBV suggests that accumulation is occurring, which is exactly what you want to see in a bullish breakout attempt. The score of 7 reflects that while OBV is supportive, it is not at extreme levels that would suggest the move is exhausted.
Score: 7 / 10 | Bullish
Chart Patterns: No clear setup, but structure is sound
There is no clear chart pattern visible on the daily timeframe as of August 26, 2026. This means that price action is not forming a recognizable triangle, flag, cup and handle, or double bottom. Without a defined pattern, we cannot calculate a measured target or confirm a textbook setup. However, the absence of a pattern does not negate the bullish indicators: the trend is up, the moving averages are aligned, and volume is supporting the move. The score of 5 reflects that patterns are neutral, neither confirming nor denying the broader bullish bias.
Score: 5 / 10 | Neutral
Indicator | Reading | Score / 10 |
|---|---|---|
RSI (14) | 73.1, momentum strong but watch for exhaustion | 8 |
EMAs (20 / 50 / 100 / 200) | All stacked bullish, price above all four | 9 |
Bollinger Bands | Upper half of channel, $0.005275 next target | 7.5 |
Fibonacci | At 0.786 level, inflection point for next move | 9 |
Support | Nearest at $0.002642, too far away | 3.5 |
Resistance | Swing high at $0.005441 blocks the way | 7 |
Trendline | Ascending at $0.004154, price above support | 8 |
MACD | Line above signal, histogram expanding upward | 8.5 |
On-Balance Volume | Rising trend confirms accumulation on strength | 7 |
Chart Patterns | No clear pattern detected on daily chart | 5 |
Cumulative Average | BULLISH bias across the board: I'm going long | 7.3 |
I'm going long here because the cumulative score of 7.3 out of 10 is solidly bullish, and the setup has real technical merit. Nine of my ten indicators are pointing higher, the moving averages are stacked perfectly, and MACD is expanding. The price is exactly at the 0.786 Fibonacci level, which is a classic inflection zone where breaks either lead to new highs or pullbacks. I'm risking the break of the trendline because that would prove the trend structure has failed.
My entry zone | $0.004700 – $0.004844 |
My stop loss | $0.004100 (below ascending trendline at $0.004154) |
My target 1 | $0.005275: Bollinger Bands upper band |
My target 2 | $0.005441: swing high resistance |
My target 3 | $0.006000: structural breakout level |
Risk : Reward | 1 : 2.8 (T1) / 1 : 4.2 (T2) |
Position | Long |
I would exit my entire position and flip to short if price closes below the ascending trendline at $0.004154. That level is the structural support for the uptrend, and a break below it would mean higher lows are no longer being established. If I see a daily close below $0.004154, I would interpret that as confirmation that the move is exhausted and mean reversion is likely. Additionally, if RSI rolls over and MACD histogram begins to contract while price is still above resistance, I would reduce size immediately because that would signal momentum is fading even if price hasn't technically broken support yet.
Disclaimer: This article is produced for informational and educational purposes only and does not constitute financial or investment advice. Cryptocurrency markets are highly volatile and carry significant risk. Always conduct your own research and consult a qualified financial adviser before making any trading decisions.
This altcoin is flashing green signals across nearly every indicator, but one major warning sign could derail the upside.
 STG
STG
A small altcoin is staging a quiet rally. Here's why traders are watching closely.
 ZBCN
ZBCN-768x432.png&w=3840&q=75&dpl=dpl_2a1LjK7J47ZhhwjhB7eFPuxwceT3)
A small-cap token just flipped bullish. Most traders haven't noticed yet.
 INIT
INIT
