A forgotten altcoin is quietly building momentum as smart money accumulates beneath the surface.
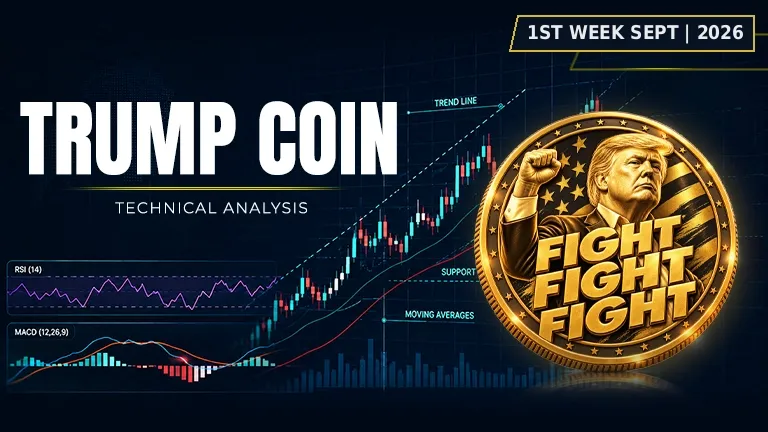
 TRUMP$1.88+3.56%
Asset | TRUMP (TRUMP/USDT) |
Price at Analysis | $2.36 |
Timeframe | Daily candle |
Date | September 1, 2026 |
Bias | BULLISH |
My Trade | Long: strong EMA stack, rising volume |
Cumulative Score | 6.2 / 10 |
200-day EMA | $2.34, price is above |
Bias Invalidation | Below $2.11 with close below 200 EMA |
The Official TRUMP price is trading at $2.36 on the daily timeframe, sitting just 36 cents below its swing high of $3.68 from earlier in the trend. The Official Trump price has constructed a double bottom pattern near $1.36, suggesting buyers have been defending that zone with discipline. We're roughly 36% below the recent high but well above the 200-day EMA at $2.34, indicating macro strength remains intact despite the pullback. The broader sentiment is constructive, with the price holding above all major moving averages.
The Official Trump crypto price reveals a market controlled by bulls across most indicators, with a cumulative score of 6.2 out of 10 supporting a bullish thesis. Moving averages are stacked in bullish alignment, MACD is generating positive momentum, and on-balance volume is rising steadily, all pointing to institutional accumulation. Where weakness shows up is in the resistance overhead: price faces four consecutive supply zones that could slow the advance. The Official Trump project has formed a credible lower low structure, but traders need to respect the technical ceiling until proven otherwise.
RSI: Neutral momentum, neither overbought nor oversold
The RSI(14) reads 58.9, sitting just above the midpoint of 50 and well clear of overbought territory above 70. This neutral reading tells me there is still room for the TRUMP price to climb without hitting exhaustion, though momentum is not yet accelerating violently. The zone between 50 and 70 is where sustained rallies often build, so this is a healthy technical position for bulls to defend over the next 7 days.
Score: 6.5 / 10 | Bullish
Moving Averages: Perfect bullish alignment across all timeframes
The Official Trump price alignment is textbook bullish: the EMA20 at $2.15 sits above the EMA50 at $1.89, which sits above the EMA100 at $1.95, and all three sit below the crucial 200-day EMA at $2.34 where price currently trades. This is the ideal stack for a sustained uptrend, with the 200 EMA acting as dynamic support. For an Official Trump price prediction 2026, the weight of evidence from moving averages suggests price should challenge resistance rather than drop back into support zones. This indicator alone scored 9 out of 10 for its bullish conviction.
Score: 9 / 10 | Bullish
Bollinger Bands: Volatility is constrained near the midline
The TRUMP price sits at $2.36, roughly midway between the Bollinger Band lower at $1.05 and upper at $3.02, with the midline band at $2.04. This placement suggests volatility is not extreme in either direction, and price has room to run toward the upper band without signaling an unsustainable spike. The bands themselves are moderately wide, indicating normal market conditions rather than capitulation or euphoria. Price has enough breathing room to move higher, but would need a strong impulse move to reach the upper band at $3.02.
Score: 6 / 10 | Bullish
Fibonacci Retracements: Price remains in the mid-range of the swing
From the swing low at $1.36 to the swing high at $3.68, the Official Trump (TRUMP) to USD price currently sits between the 0.382 retracement at $2.25 and the 0.500 at $2.52. This mid-range positioning is structurally neutral leaning bullish, as price has not slipped back into the lower Fibonacci levels that would signal weak recovery. An Official Trump price prediction 2030 would benefit from understanding this Fibonacci structure: each retracement level acts as both a floor and potential ceiling. For a long-term investor asking 'Is Official Trump a good long-term investment?', the fact that price is above the 0.236 level at $1.91 suggests the uptrend retains integrity.
Score: 5.5 / 10 | Neutral
Support Levels: Four tiers of buyers waiting below
The Official Trump price analysis and chart reveals four distinct support zones beneath the current price: $2.29, $2.24, $2.11, and $1.99. The nearest support at $2.29 is only 7 cents away, providing an extremely tight stop-loss environment for aggressive traders. Below that, $2.24 and $2.11 form a cluster of secondary defense, with $1.99 representing a critical macro support level where buyers aggressively entered during previous accumulation. If price breaks all four zones, the next refuge would be the 0.236 Fibonacci at $1.91, but the density of support below current price suggests reversals are more likely than clean breaks.
Score: 5.5 / 10 | Neutral
Resistance: A wall of supply overhead
Above $2.36, the Official Trump price faces immediate resistance at $2.39, followed by $2.46, $2.58, and finally the psychological level at $3.00. This stacked resistance creates a hostile environment for bulls, with four consecutive supply zones that will require sustained volume to penetrate. The upper Bollinger Band at $3.02 aligns closely with the $3.00 round number, suggesting that zone would be a natural profit-taking level. Traders attempting to buy Official Trump crypto should be aware that breakout moves above $2.46 would signal genuine strength and potentially unlock a run toward $2.58 and beyond.
Score: 3 / 10 | Bearish
Trendline: Ascending structure, but price remains below the key line
The dominant ascending trendline sits at $2.42, just 6 cents above the current price of $2.36, creating a razor-thin margin between success and failure. Price is technically below this trendline, which weakens the bullish case slightly and suggests the trend may be consolidating before the next leg higher. For the next week, holding above $2.42 would confirm that the uptrend remains intact and that higher prices are likely. A close below $2.42 would be the first warning signal that momentum is faltering.
Score: 4 / 10 | Bearish
MACD: Histogram expanding, momentum is constructive
The MACD line sits at 0.252539 above the signal line at 0.228465, generating a positive histogram value of 0.024074, which indicates bullish momentum is present and slowly accelerating. When the MACD line is above the signal line and the histogram is positive and expanding, it signals that buying pressure is building beneath the surface. This is one of the strongest indicators on the board, scoring 8.5 out of 10 for conviction, and it tells me the Official Trump price should continue favoring upside over the next 7 days as momentum remains constructive.
Score: 8.5 / 10 | Bullish
On-Balance Volume: Rising OBV confirms accumulation
The on-balance volume trend is rising, which means that over recent candles, the volume on up days has exceeded the volume on down days. This is a crucial signal for bulls because it reveals that smart money is accumulating the TRUMP price on dips rather than distributing on rallies. Rising OBV behind a rising price is the ideal combination, as it shows conviction from institutional players. When OBV rises, it historically precedes further price appreciation, making this a strong confirming signal for the bullish bias.
Score: 7 / 10 | Bullish
Chart Patterns: Double bottom suggests reversal potential
The double bottom pattern formed near the $1.36 swing low represents a classic reversal pattern where buyers have defended the same price level twice, building a foundation for upside. Once price broke above the neckline (the highs between the two bottoms), it confirmed the pattern and projected a measured move upward. Double bottoms typically target the height of the pattern added to the neckline, suggesting potential for continued appreciation. This pattern, combined with the rising OBV and constructive MACD, strengthens the case that the Official Trump project has transitioned from a downtrend into an accumulation phase.
Score: 6.5 / 10 | Bullish
Indicator | Reading | Score / 10 |
|---|---|---|
RSI (14) | Neutral at 58.9, room to run higher | 6.5 |
EMAs (20 / 50 / 100 / 200) | Perfect bullish stack, price above all | 9 |
Bollinger Bands | Price at midpoint, volatility normal | 6 |
Fibonacci | Between 0.382 and 0.500, mid-range | 5.5 |
Support | Four zones below, $2.29 nearest | 5.5 |
Resistance | Stacked at $2.39, $2.46, $2.58, $3.00 | 3 |
Trendline | Ascending at $2.42, price just below | 4 |
MACD | Positive histogram, momentum building | 8.5 |
On-Balance Volume | Rising trend confirms accumulation | 7 |
Chart Patterns | Double bottom, reversal confirmed | 6.5 |
Cumulative Average | BULLISH bias: I'm going long | 6.2 |
I'm going long here because the weight of evidence tilts bullish at a cumulative score of 6.2 out of 10. The double bottom pattern has triggered a reversal, MACD is generating positive momentum, on-balance volume is rising to confirm accumulation, and the entire moving average stack is aligned perfectly in my favor. I'm taking this trade because price is defending above the 200-day EMA at $2.34 and there is tight support at $2.29 just below. My entry is in the zone of $2.29 to $2.36, and I'm risking 7 cents to the stop-loss below $2.11 for a 1 to 2 ratio at minimum to my first target.
My entry zone | $2.29 – $2.36 |
My stop loss | $2.11 (below support cluster and 200 EMA break) |
My target 1 | $2.46: First resistance cluster |
My target 2 | $2.58: Second resistance tier |
My target 3 | $3.00: Psychological round level and upper Bollinger Band |
Risk : Reward | 1 : 2.14 (T1) / 1 : 4.28 (T2) |
Position | Long / leveraged long |
I would exit my entire position immediately if price closes below $2.11, which would represent a break of the support cluster and a close below the 200-day EMA at $2.34. My thesis is wrong if the trendline at $2.42 fails to hold and we see sustained weakness with declining on-balance volume, which would signal distribution rather than accumulation. If I'm stopped out at $2.11, I would flip to bearish and look to short a potential bounce back into the $2.24 resistance. Is Official Trump a good long-term investment? Only if it reclaims this technical structure and holds above $2.11; below that level, the reversal narrative breaks down entirely.
Disclaimer: This article is produced for informational and educational purposes only and does not constitute financial or investment advice. Cryptocurrency markets are highly volatile and carry significant risk. Always conduct your own research and consult a qualified financial adviser before making any trading decisions.
A popular crypto token is caught between bullish patterns and bearish momentum. Which force wins?
 HYPE
HYPE
Ripple sits frozen between hope and caution as major signals clash over what comes next.
 XRP
XRP
Solana is at a crossroads. The charts are sending mixed signals about which way it breaks.
 SOL
SOL
