DefiLlama is an analysis platform where you can check the analysis data integrated from different blockchain networks. It is the largest TVL aggregator for Defi (Decentralized Finance) that aggregates data from more than 100+ networks and applications. The DefiLlama platform gives you a comprehensive and detailed record of each chain and the applications based on it. The platform source code is open and is maintained by the contributors from different protocols.
So, in this article, we will explain what kind of data you can find in the DefiLama platform and how to understand it.
Table of Contents
Access the DefiLlama Platform
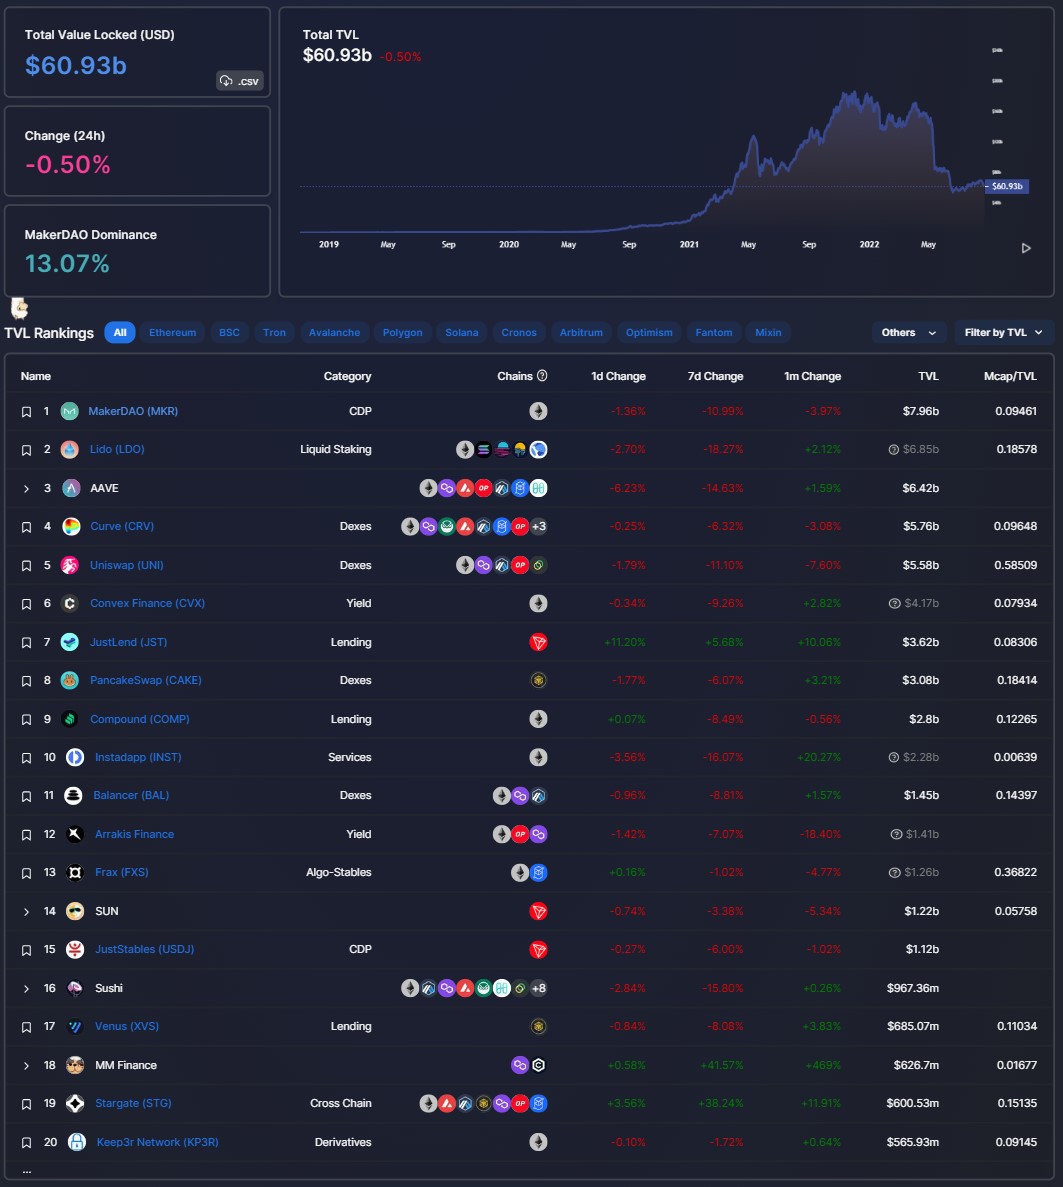
To access the DefiLlama website, visit the link. You can see the below screen.
From the DefiLlama portal, you can see and track the stats of the entire Defi eco-space. You can find various sections in the dashboard where you can go and check the analytics data about the below fields:
- Defi, Yield, and StableCoins data
- Chains
- Airdrops
- Oracles
- Forks
- Liquidation levels in Defi
- Top Protocols
We will explain each of these segments and help you in understanding the data maintained by the platform.
Overview
From this tab, you can check the total value locked in All the blockchain protocols involved. A TVL or Total Value Locked is the number of assets that the users have locked into the protocol.
Top Part
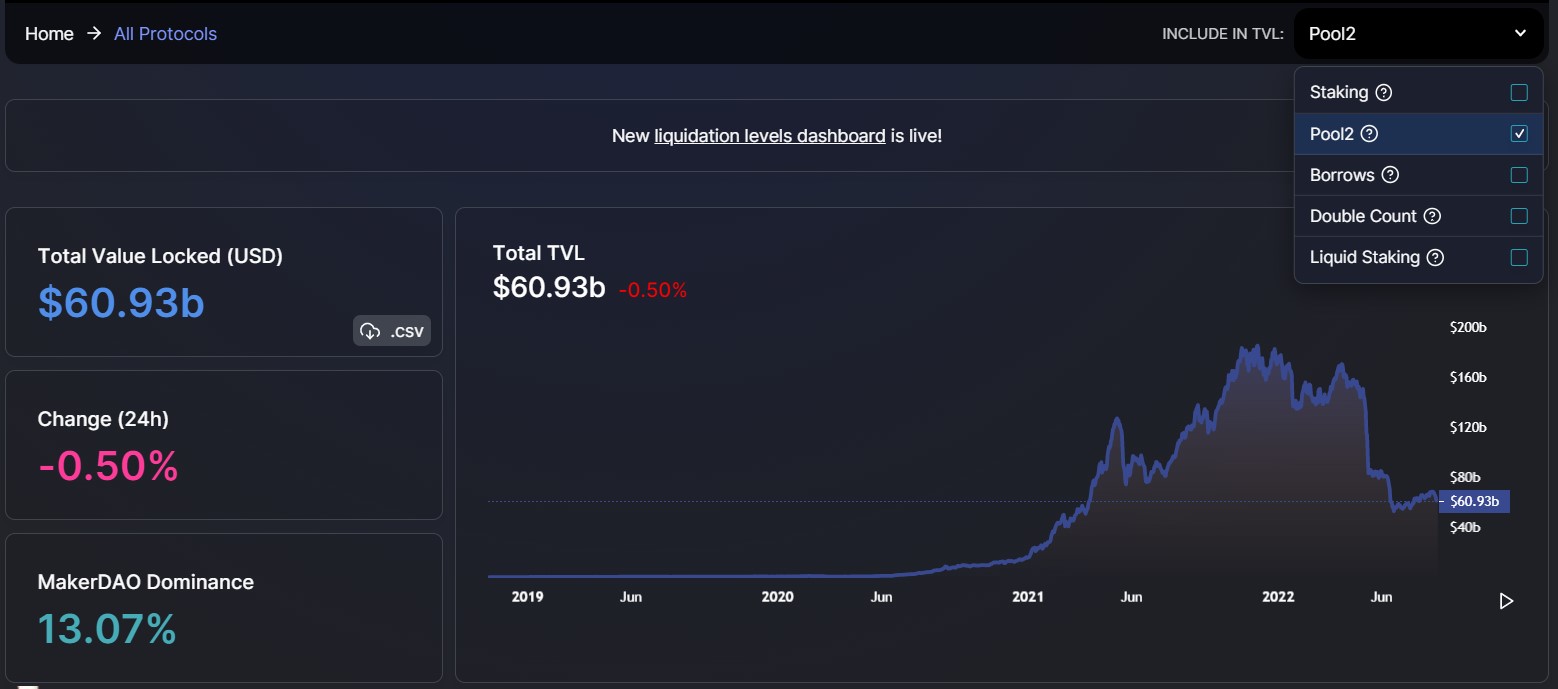
From the top part of the overview tab, you can check the total number of assets that all crypto users have locked into the network along with the percentage change in 24hr, and the major contributing protocol (MakerDAO) and its percentage.
Note that the TVL value does not include the tokens locked in the below programs:
- Governance token staked in the protocol
- Staked LP tokens paired with governance tokens
- Token borrowed from the lending protocols
- TVL of protocols whose TVL feeds into other protocols
- Rewards and liquidity for staked assets
If you wish to include any of the above parameters, check the desired box and see the updated TVL data.
Bottom Part
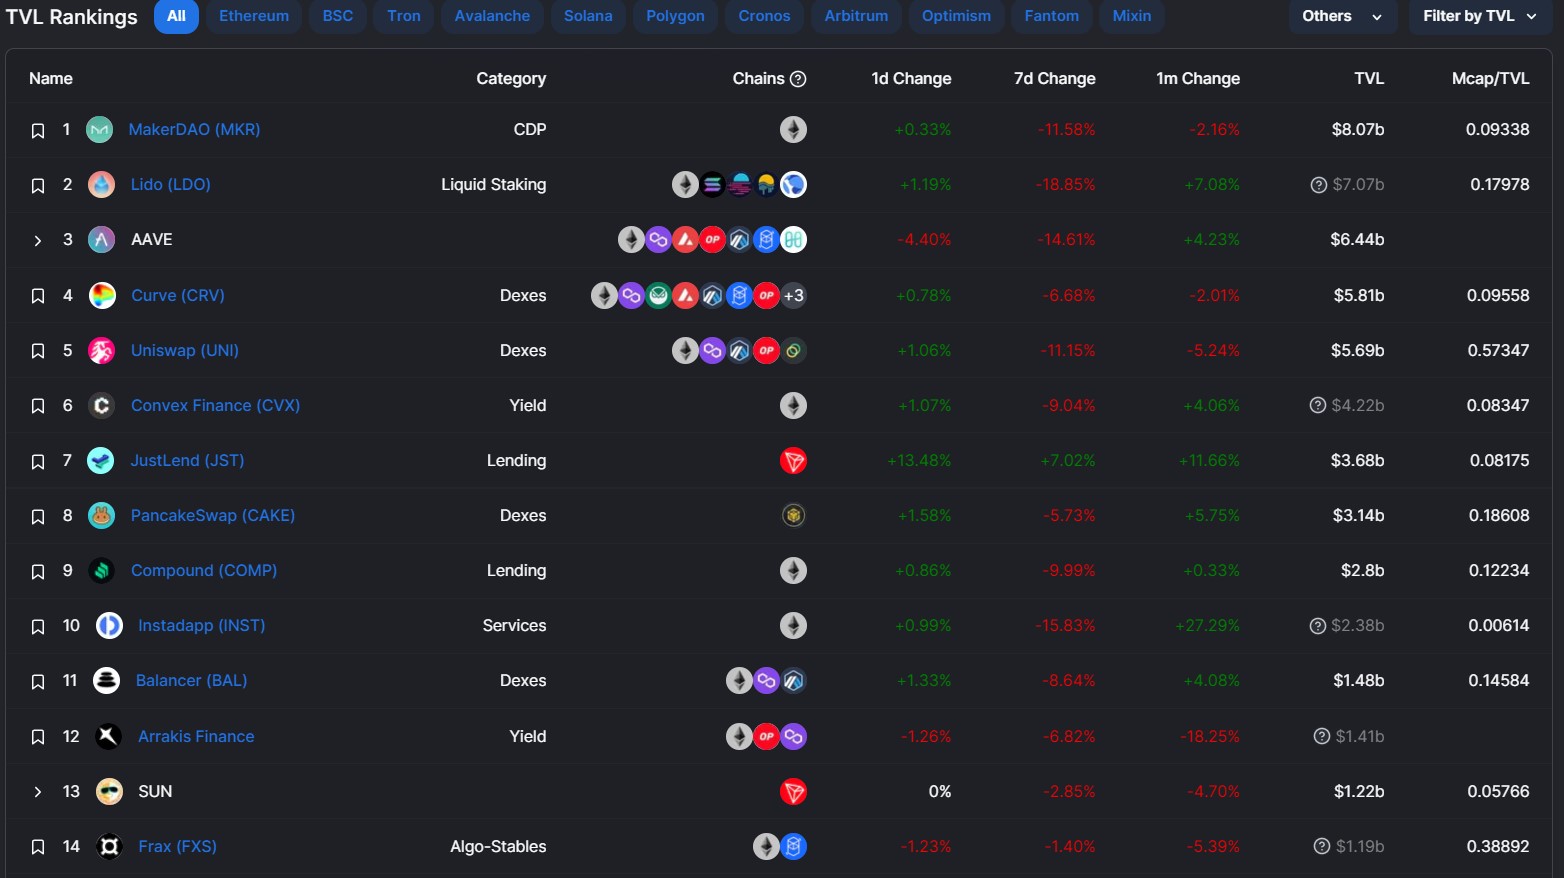
From the bottom section, you can check more detailed information about the protocols. Below is the key information that you can get from this section:
- Protocol (Project) Name
- Type of Protocol (DEX, Lending, CDP, etc)
- Different Chains supporting the project
- 1D Change
- 7D Change
- 1M Change
- TVL
- MCap/TVL
The projects are arranged based on TVL locked. From the Chain field, you can check the network ranking in respect of the TVL locked in the network.
You can even filter the whole data based on TVL locked i.e based on max and min TVL.
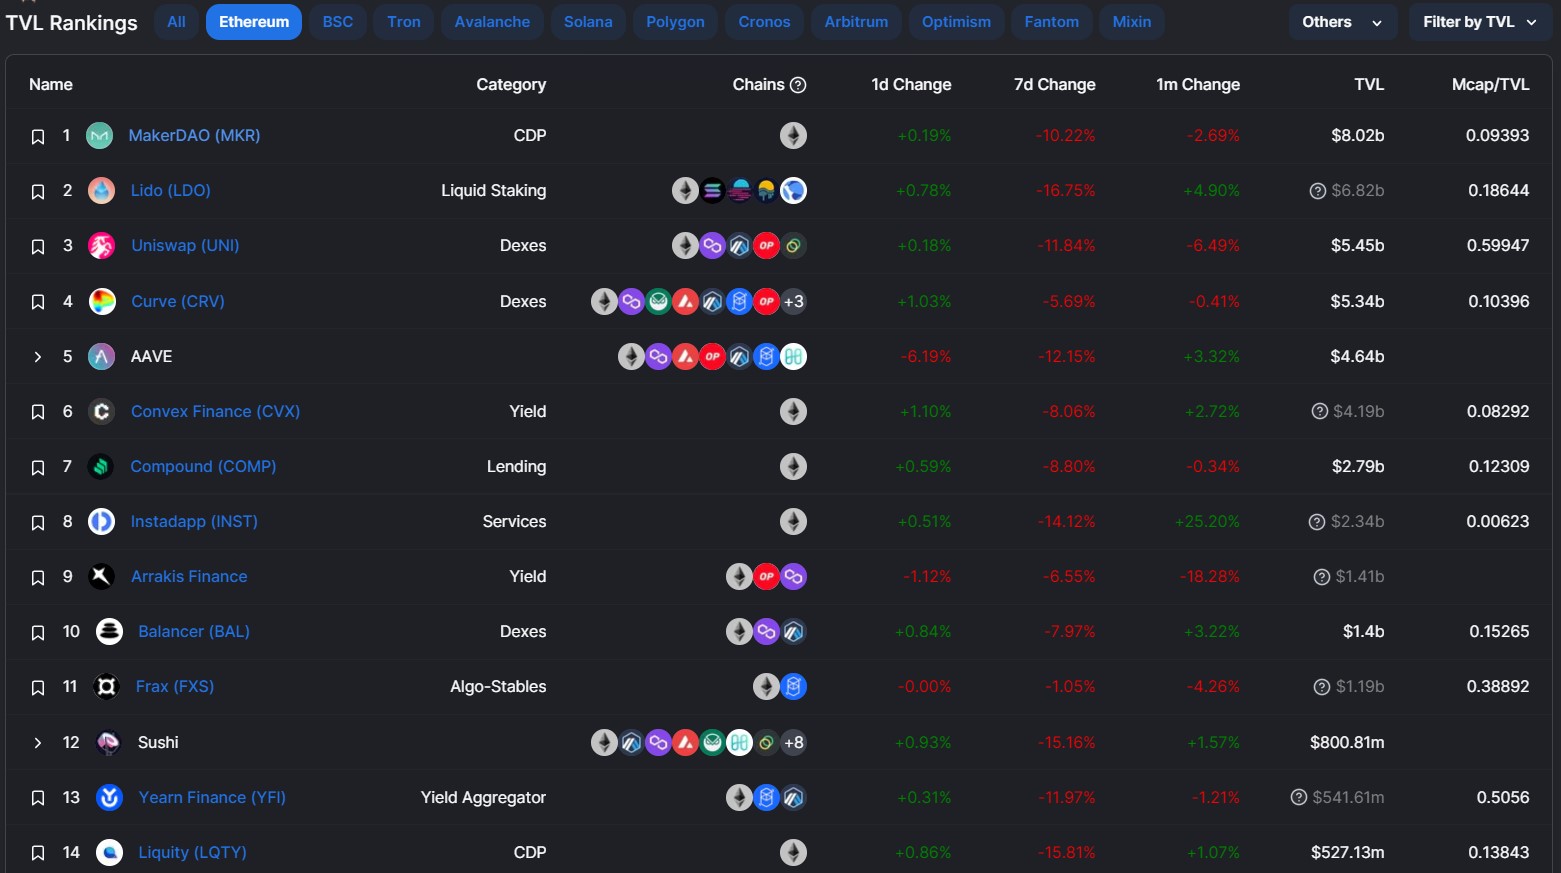
Users can go to each Network tab (like Ethereum, BSC, etc) to see details about only those projects that are based on that particular network. Users can further drill down to get data at project levels.
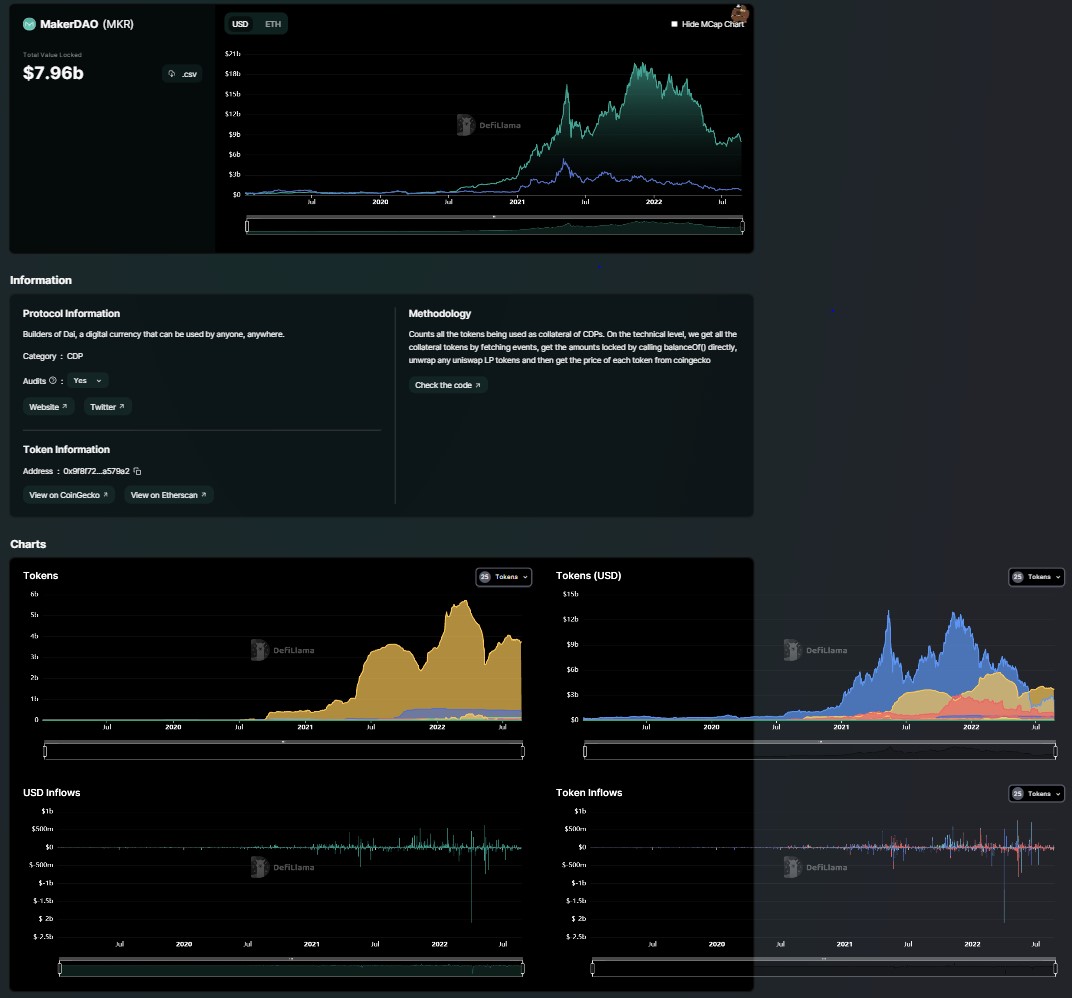
For example, you can select the Ethereum network to see the Ethereum-based projects. Next, under projects, you can select Uniswap or MakerDAO, to get detailed information about that particular project.
As you can see from the above screenshot, we have navigated to an Ethereum-based project i.e MakerDAO. Here you can check the following information about the project:
- Short description of the project
- What Type of project it is
- Whether the project is audited or not
- A link to the project website and its Twitter page
- Chart representing multiple on-chain data including TVL, USD inflows, and token inflows
Yield Ranking
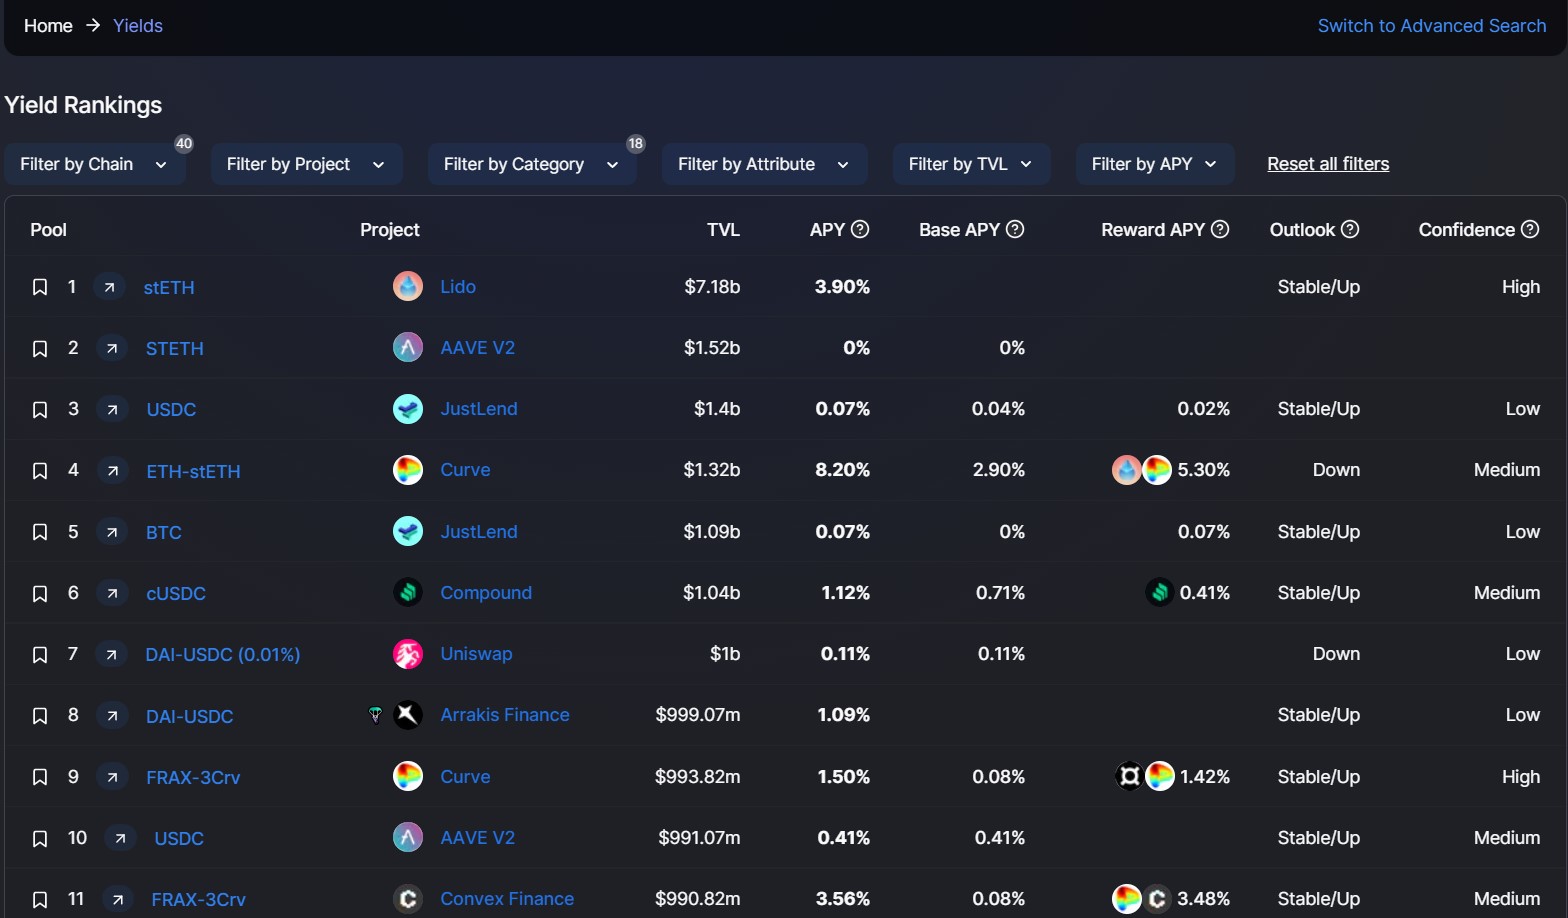
From this tab, you can check the list of pools available in various networks ranked according to their TVL value locked. Users can get the below information about the pools:
- Pool Name
- Project supporting the pool
- TVL locked
- APY
- Base APY
- Reward APY
- Outlook
- Confidence
Users can also filter the yield data based on the various parameters including:
- Network
- Project Name
- Domain (bridge, lending, etc)
- Attribute
- TVL Value
- APY
Stable Coin MarketCap
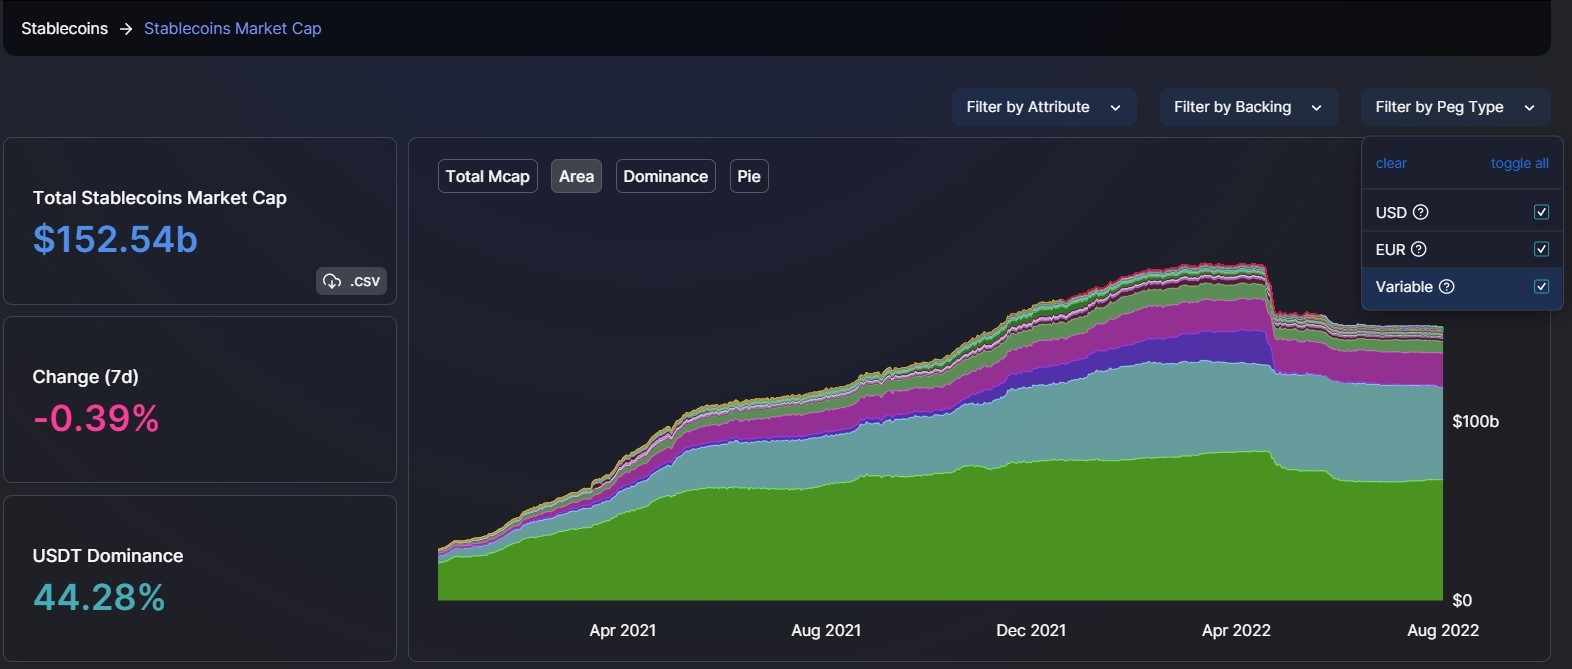
From this tab, you can get composite data about stablecoins. Here also, the graph is divided into two sections.
Top Part
From the top part, you can check the below things:
- Total Stablecoin Market
- Percentage Change in 7 days
- Major Stablecoin and its percentage dominance
From the right-hand side of the chart, you can check the trend chart of different stablecoins. Hover your cursor at any point to check the market cap of any stablecoin at any time frame.
You can download the stablecoin data in .csv format if you want by clicking on the .csv button. Users can also find various filters (by attribute, backing (fiat, crypto, algorithm), peg type (USD, EUR, Variable)) that can let them filter out the data based upon your selection.
Bottom Part
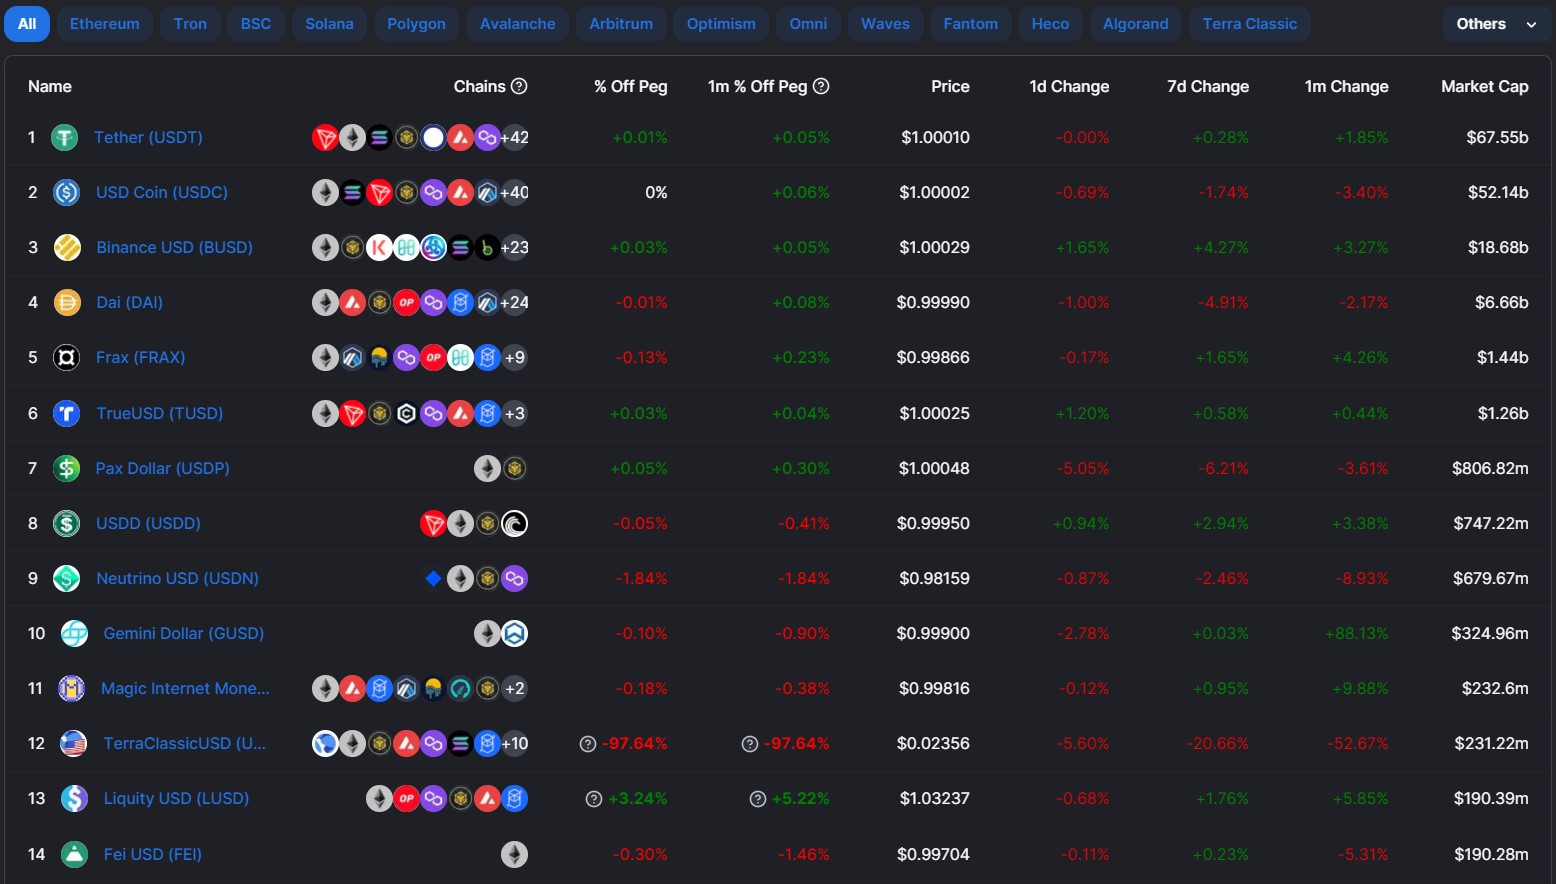
From the bottom part, you can see the stablecoin data arranged according to their market dominance percentage.
Note: Stablecoins are pegged with stable assets, commonly with US Dollar in a ratio of 1:1 to check its volatility. Other stablecoins are backed by algorithms only, not collateral.
Here, users can check the below data about stablecoins:
- Chains (list of supported chains)
- % Off Peg (deviation from pegged value)
- 1m % Off Peg (max deviation from the pegged value in 1 month)
- Price
- 1D Change
- 7D Change
- 1m Change
- MarketCap
You can go to any network tab like Ethereum, BSC, etc to check the supported stablecoins and their market value. Users can further drill down at Coin/ token level to get more detailed information.
Chains
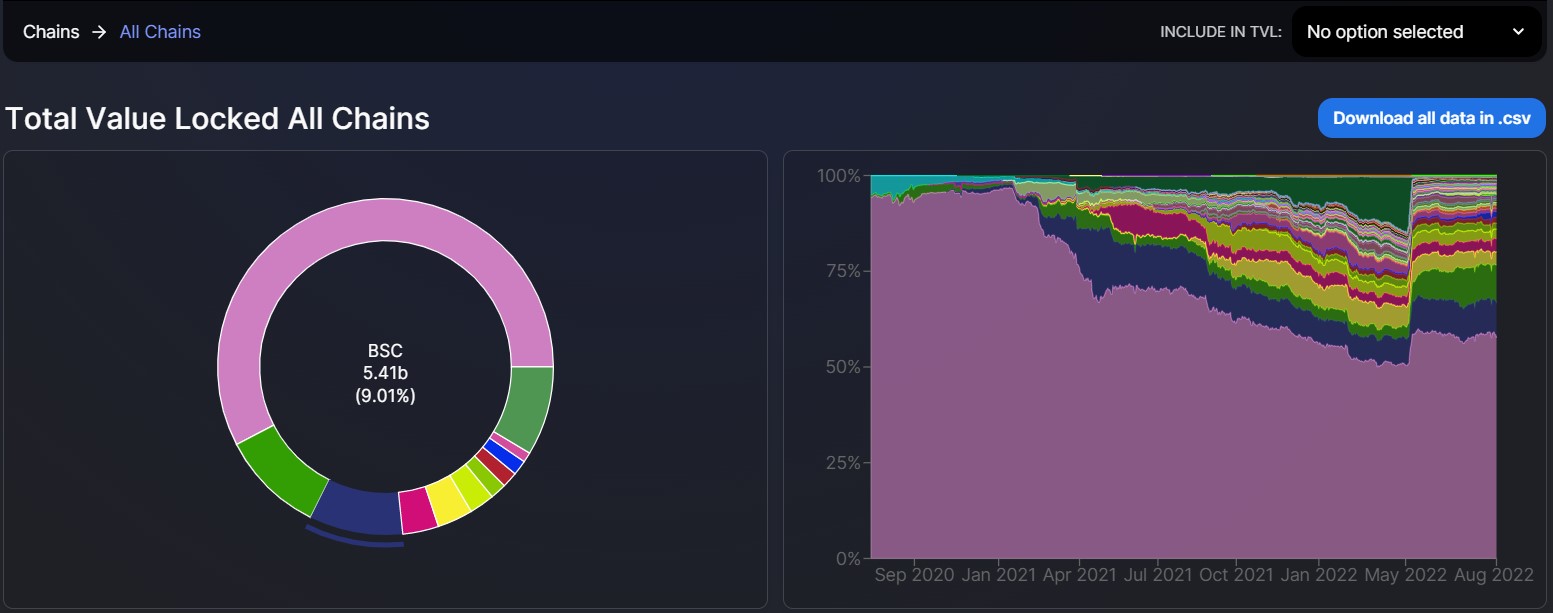
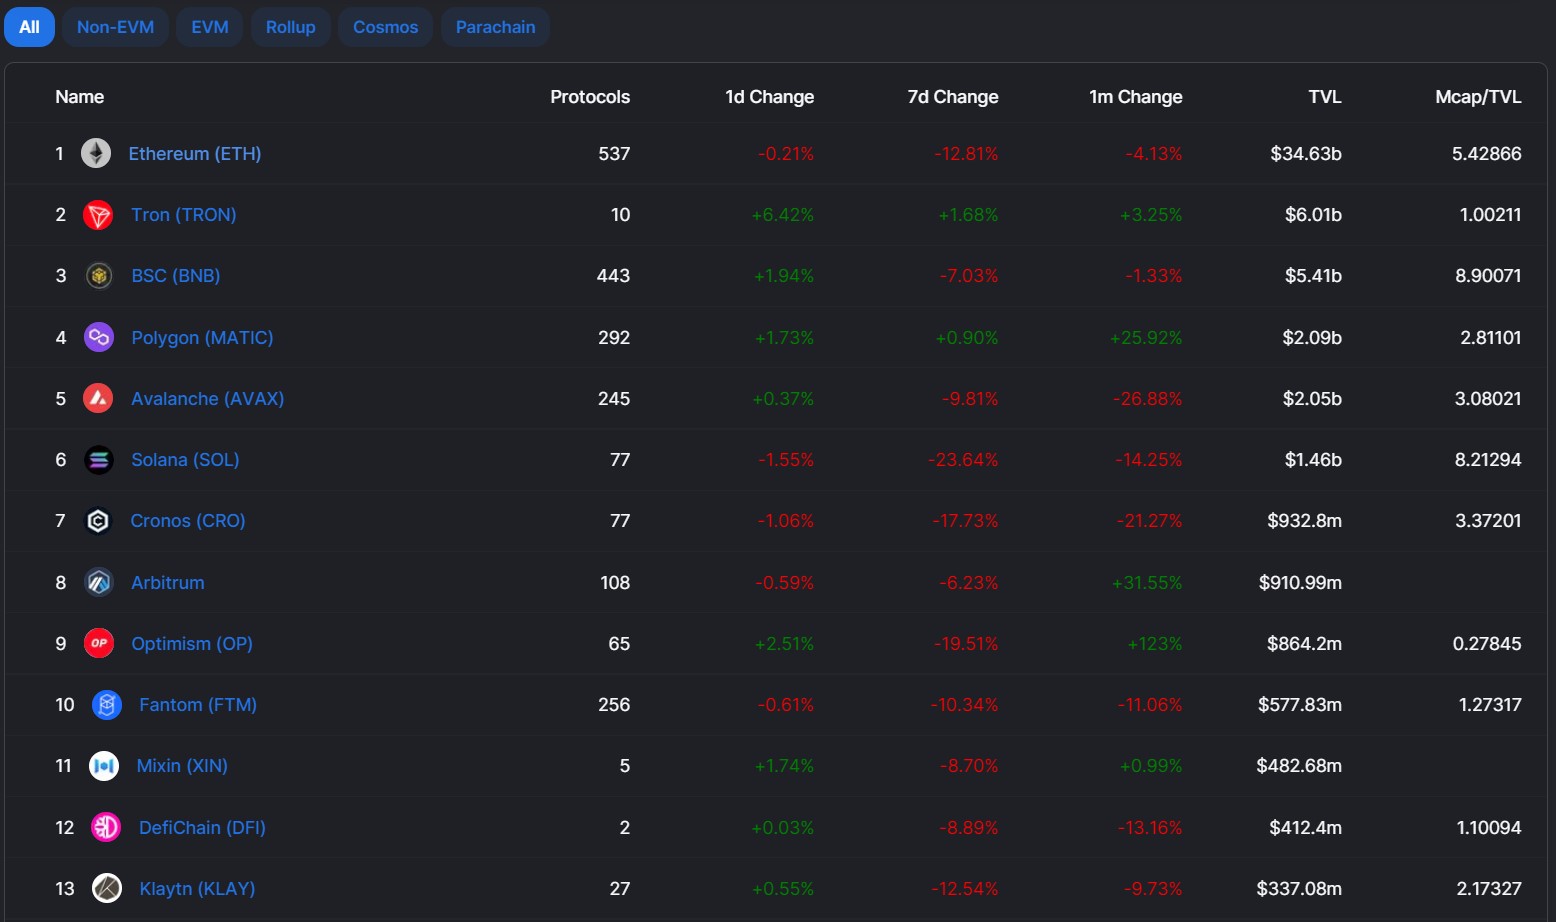
From this section, check the total value locked in different chains. Ethereum has been the major chain occupying around 58% of the overall total value locked in all chains.
From the bottom section, you can check the data depending upon chain types (Layer 1, or Layer 2) i.e EVM, Non-EVM, Cosmos, Parachain, and Rollup.
You can go to each tab to see more specific data related to a chain.
RoundUp
Check daily important news from this section.
Airdrops
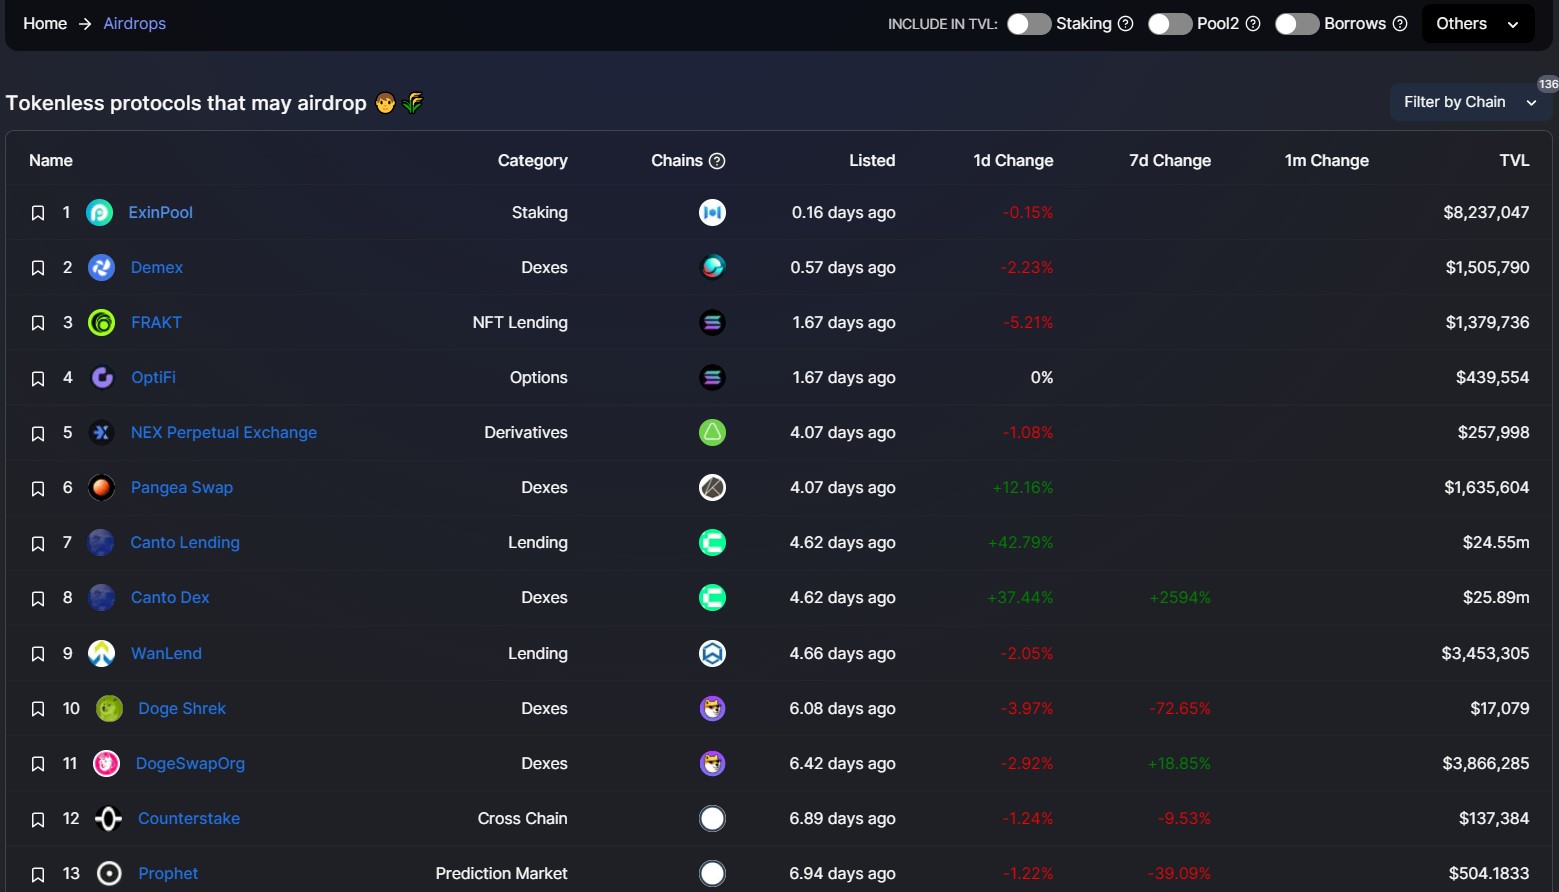
From this tab, DefiLlama can help you to keep an eye on the list of protocols that may airdrop in near future.
An airdrop is an activity to reward early users. This is a very common practice to promote the project as well as its token by distributing free native tokens upon its launch.
Oracles
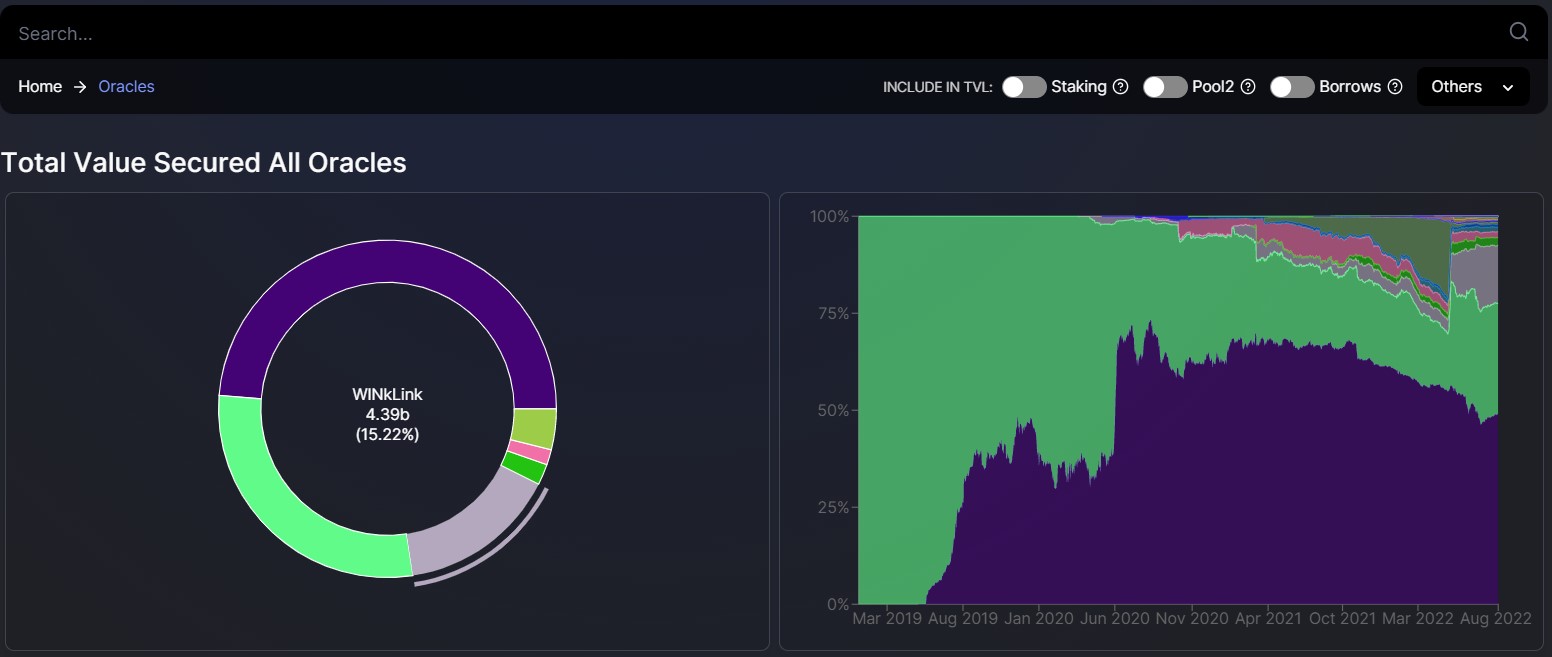
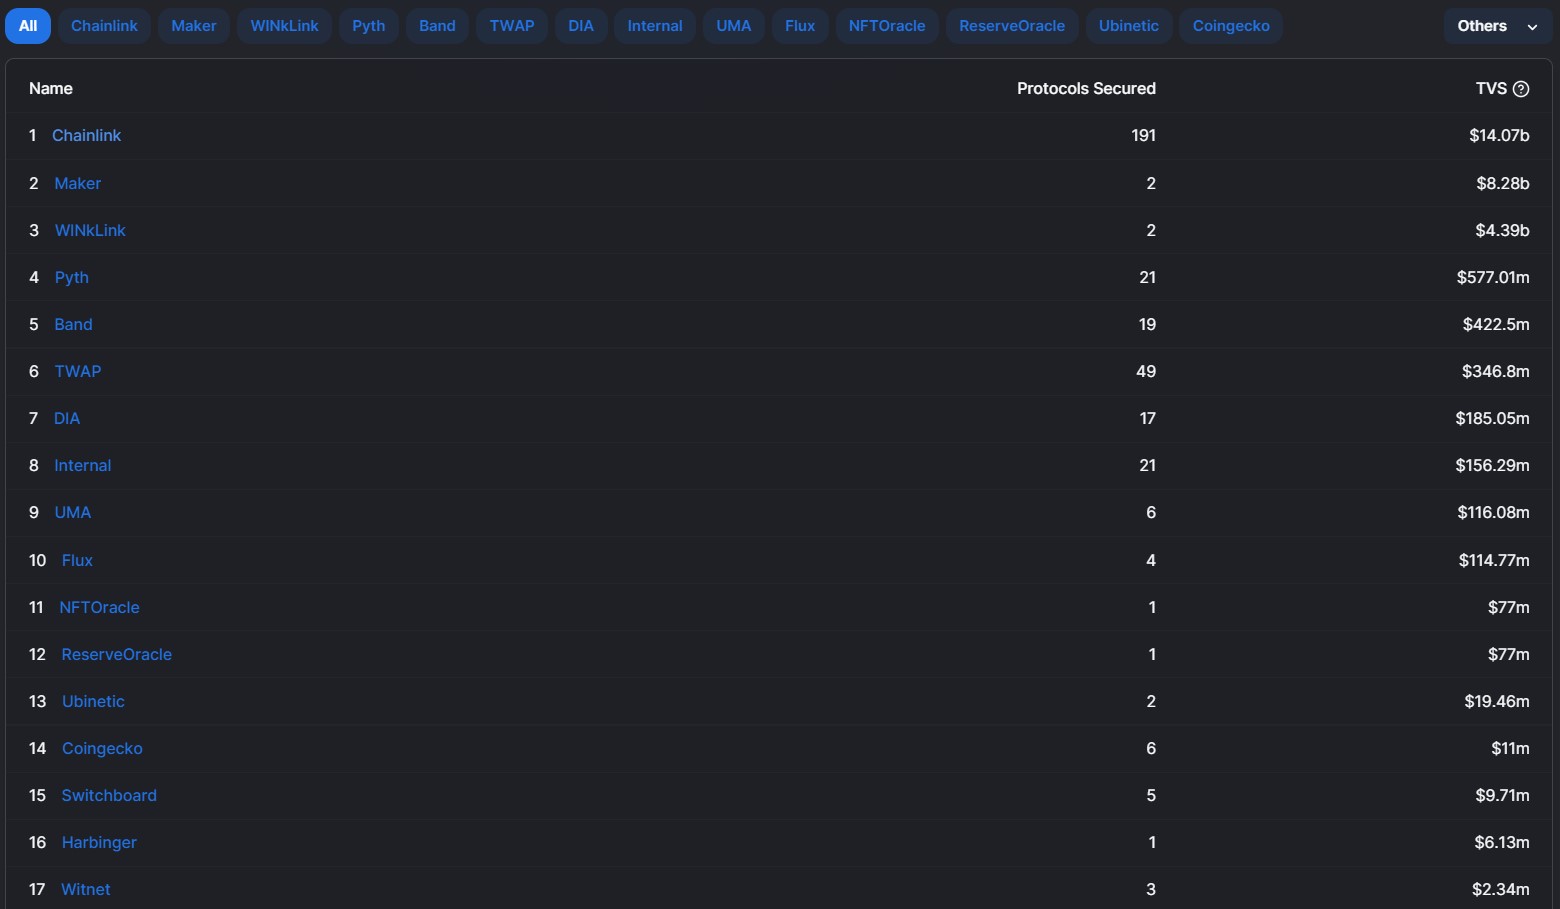
From the Oracle tab, you can check the total amount secured in the various blockchain oracles. Chainlink has been the most dominant holding around 48% of the total value.
Blockchain oracles act as an intermediary between the blockchain code i.e smart contracts and the outside world. The data is stored in the oracles and are responsible for verifying and authenticating any external input data.
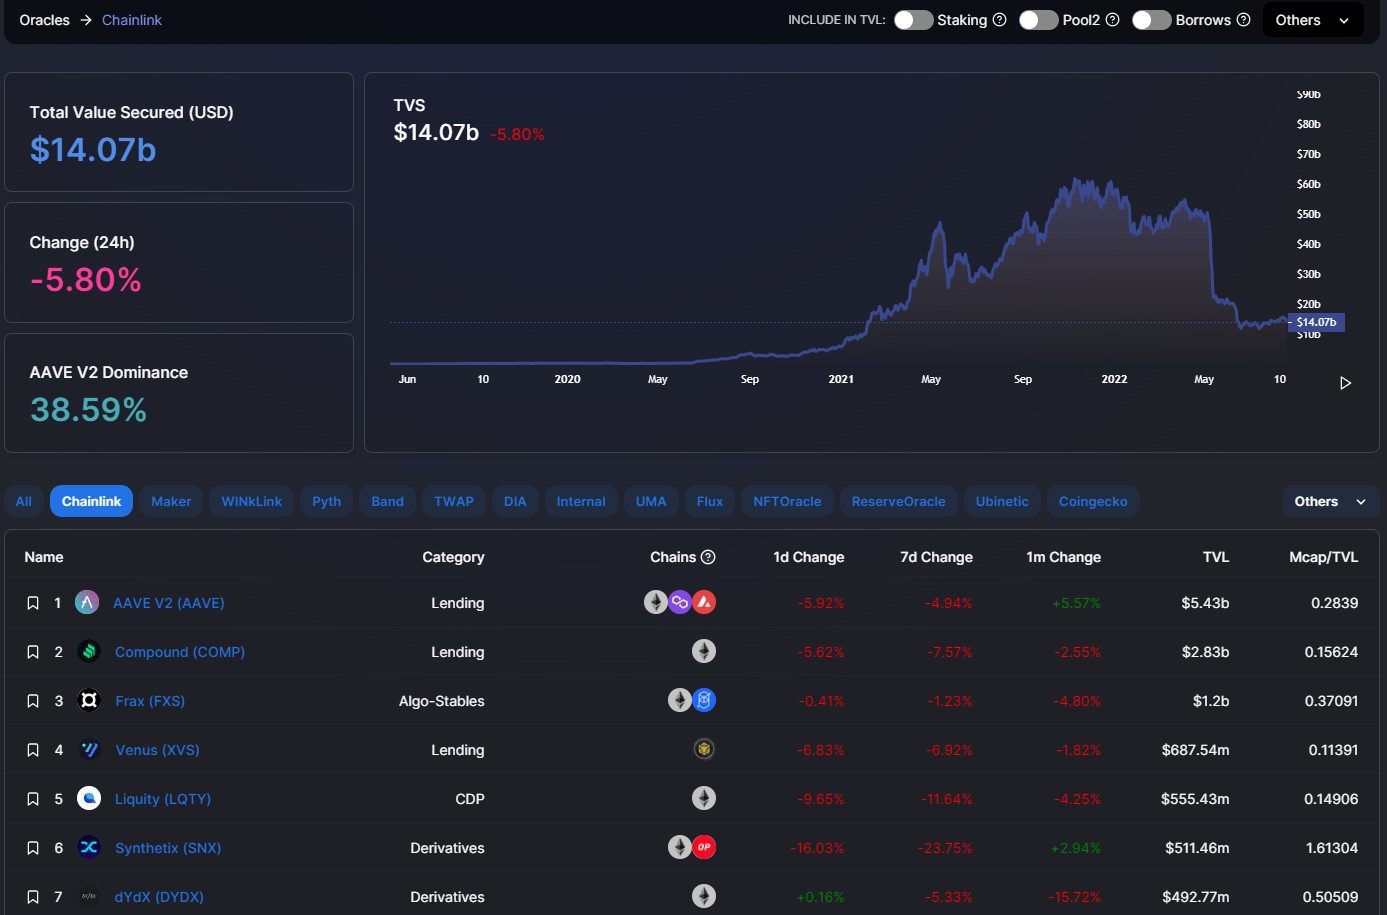
From the right-hand side of the graph, you can check the growth, inception, and participation of different oracles in the blockchain industry from the period of March 2019 – to date.
From the bottom section, you can check the different oracle lists, the number of protocols using those oracles, and the total value secured by them.
You can further drill down against each oracle to know more about the different projects using the oracles, the project dominating the major share, and the share percentage.
You can also check the rise/ fall in TVS value from the graph over a period.
Forks
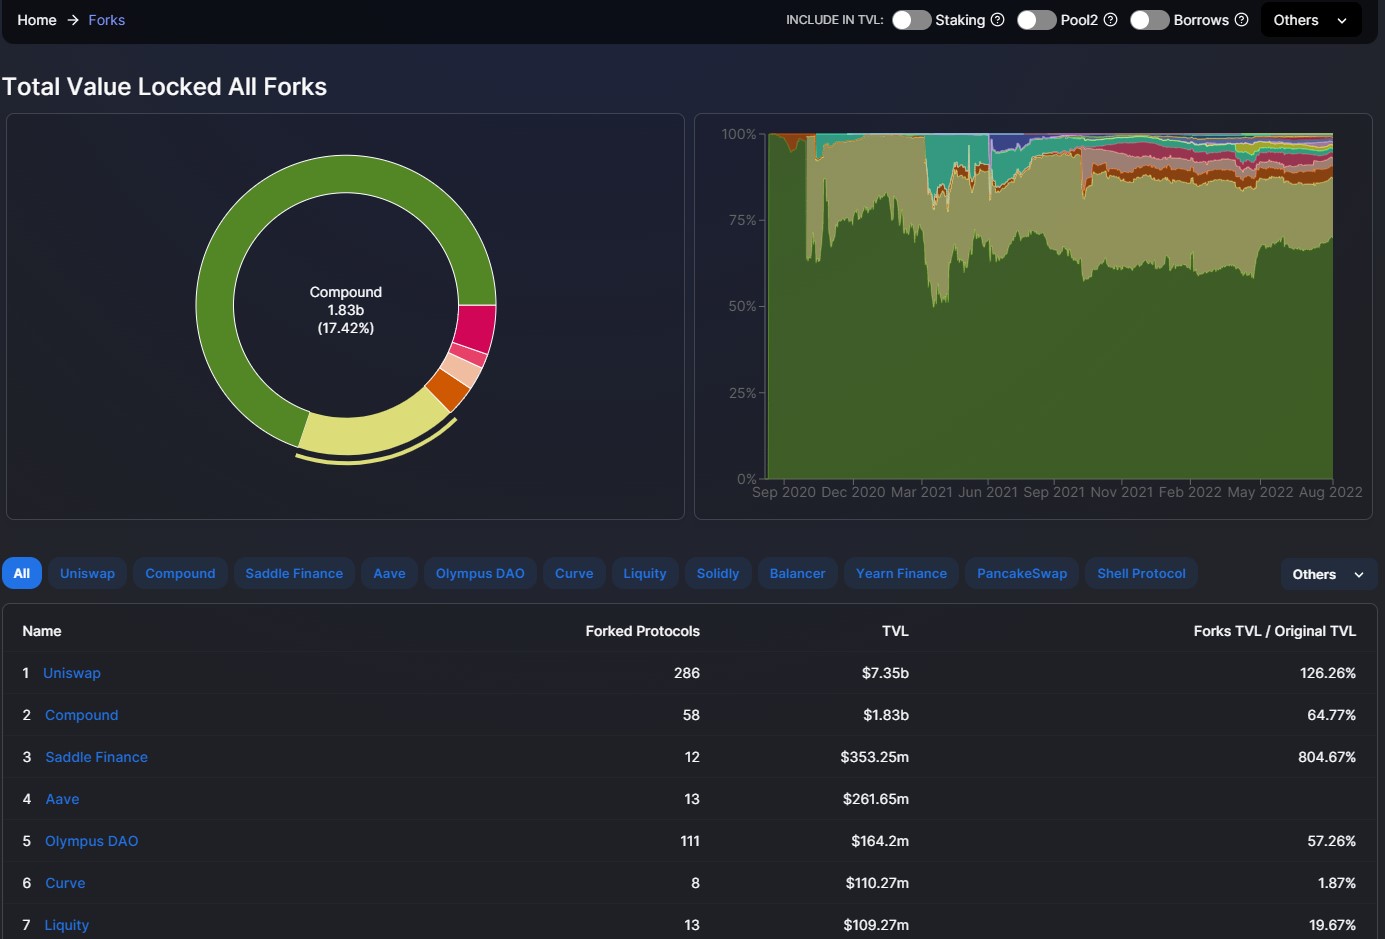
Check the total value locked in All Forks from this section.
Blockchain codes are open-source and thus anyone (developers) can change/ update them for further development. A fork happens whenever a group of community members wants to change the basic rules of the protocol. This kind of scenario led to the split in the original chain, producing a new second chain. The second chain work on the new set of rules however, it shares the history of the parent chain.
As you can see from the below screenshot, Uniswap is the most forked Defi application and is the home to 288 different forked protocols (at the time of writing the article).
If you want to get more detailed information, you can navigate down the protocol.
Liquidation
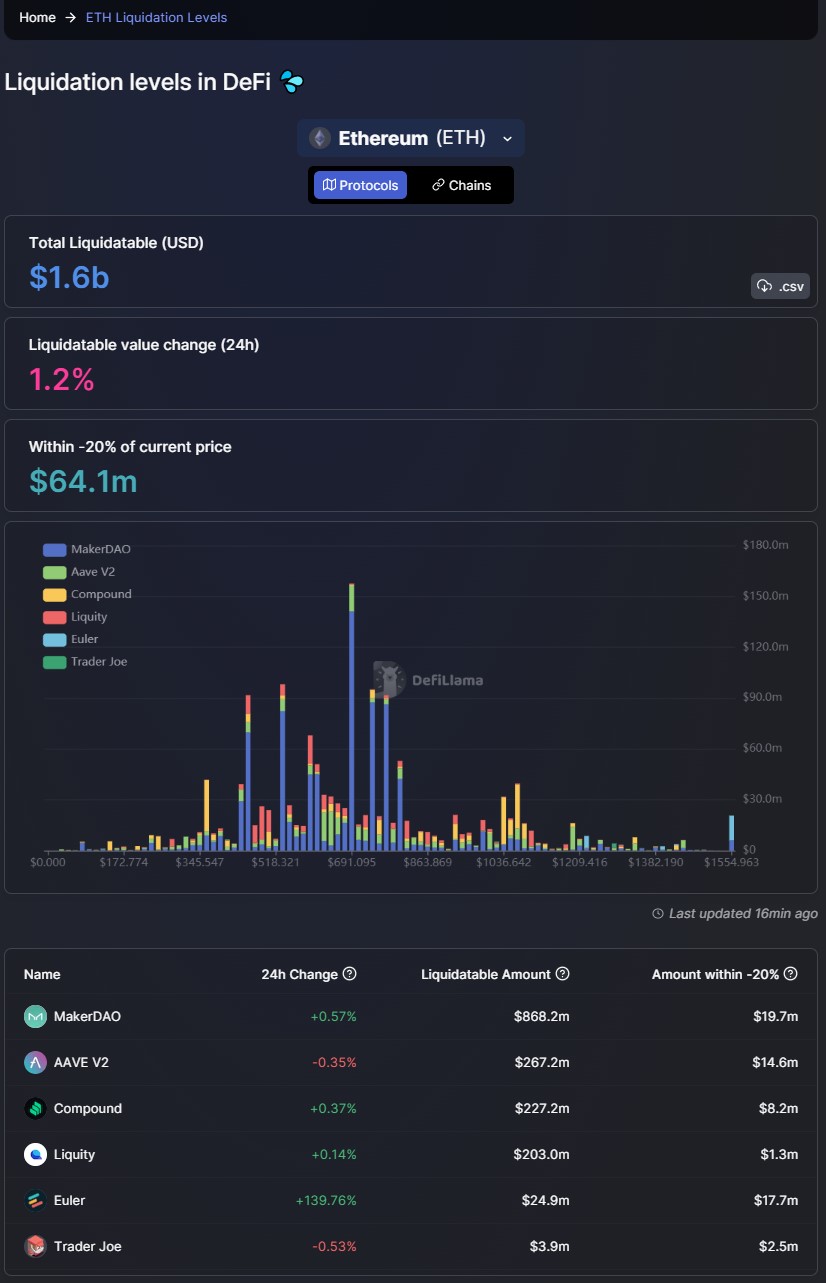
From the Liquidation Level Dashboard, users can check at any liquidation point how much amount of assets will be liquidated by the different lending protocols.
Users can select the Collateral asset at the top. You can check the networks that are using the chosen asset as collateral.
For example, we have selected ETH as collateral. From the below screenshot you can check the different lending protocols that are using ETH as collateral. Now, hover your mouse at any point to check the liquidation value, and also see how much collateral (ETH in this case) these protocols will liquidate.
At the bottom of the page, you can also check the latest refresh time.
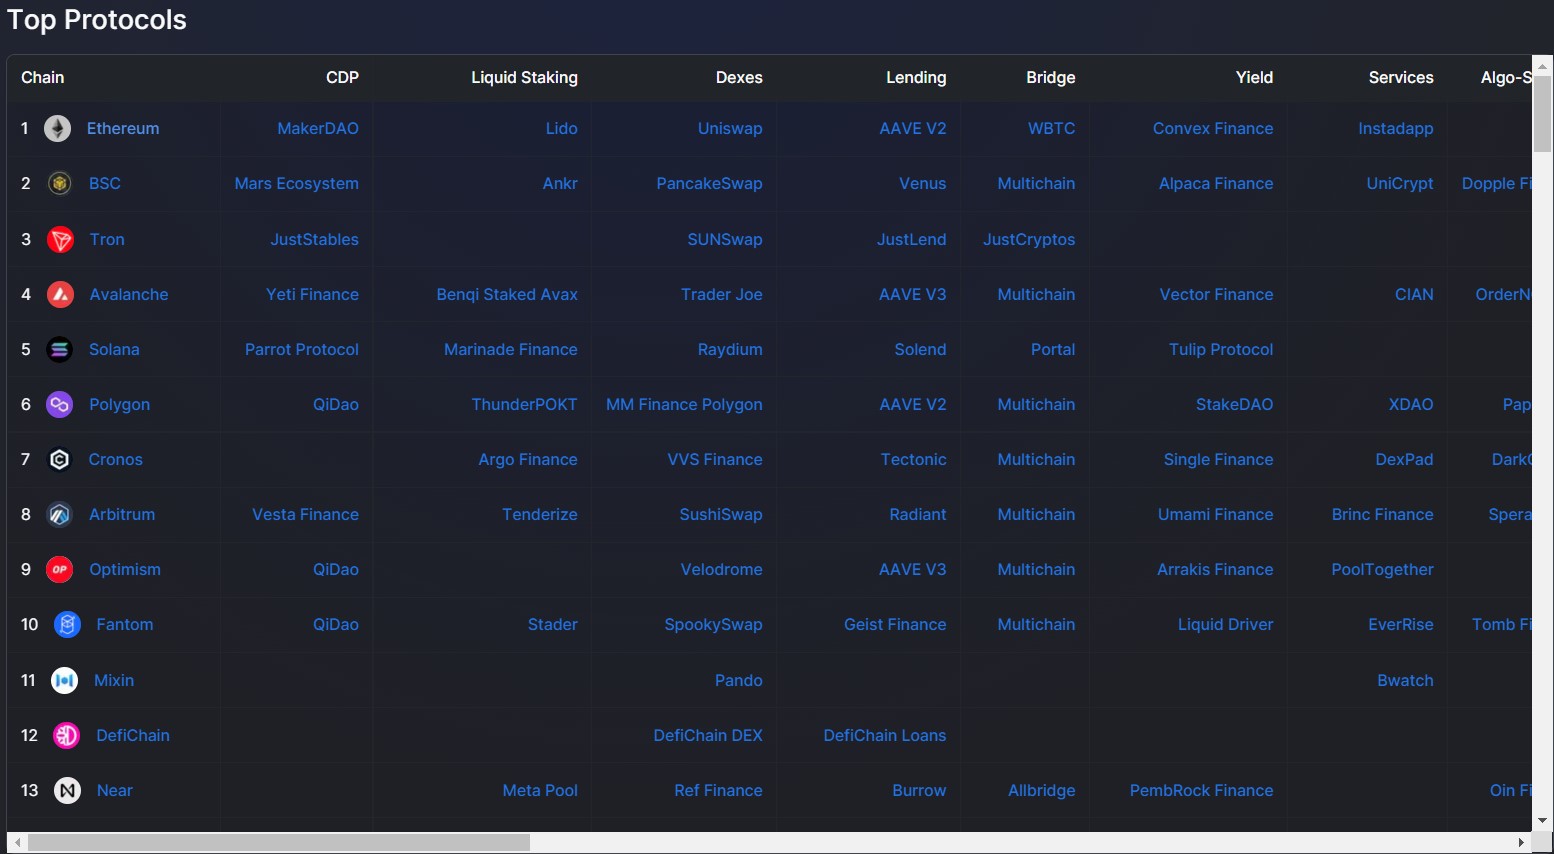
Top Protocols
From this section, you can check the list of different blockchain networks and the various dApps like CDP, Liquid staking, bridges, yield farming, aggregator, etc built on it.
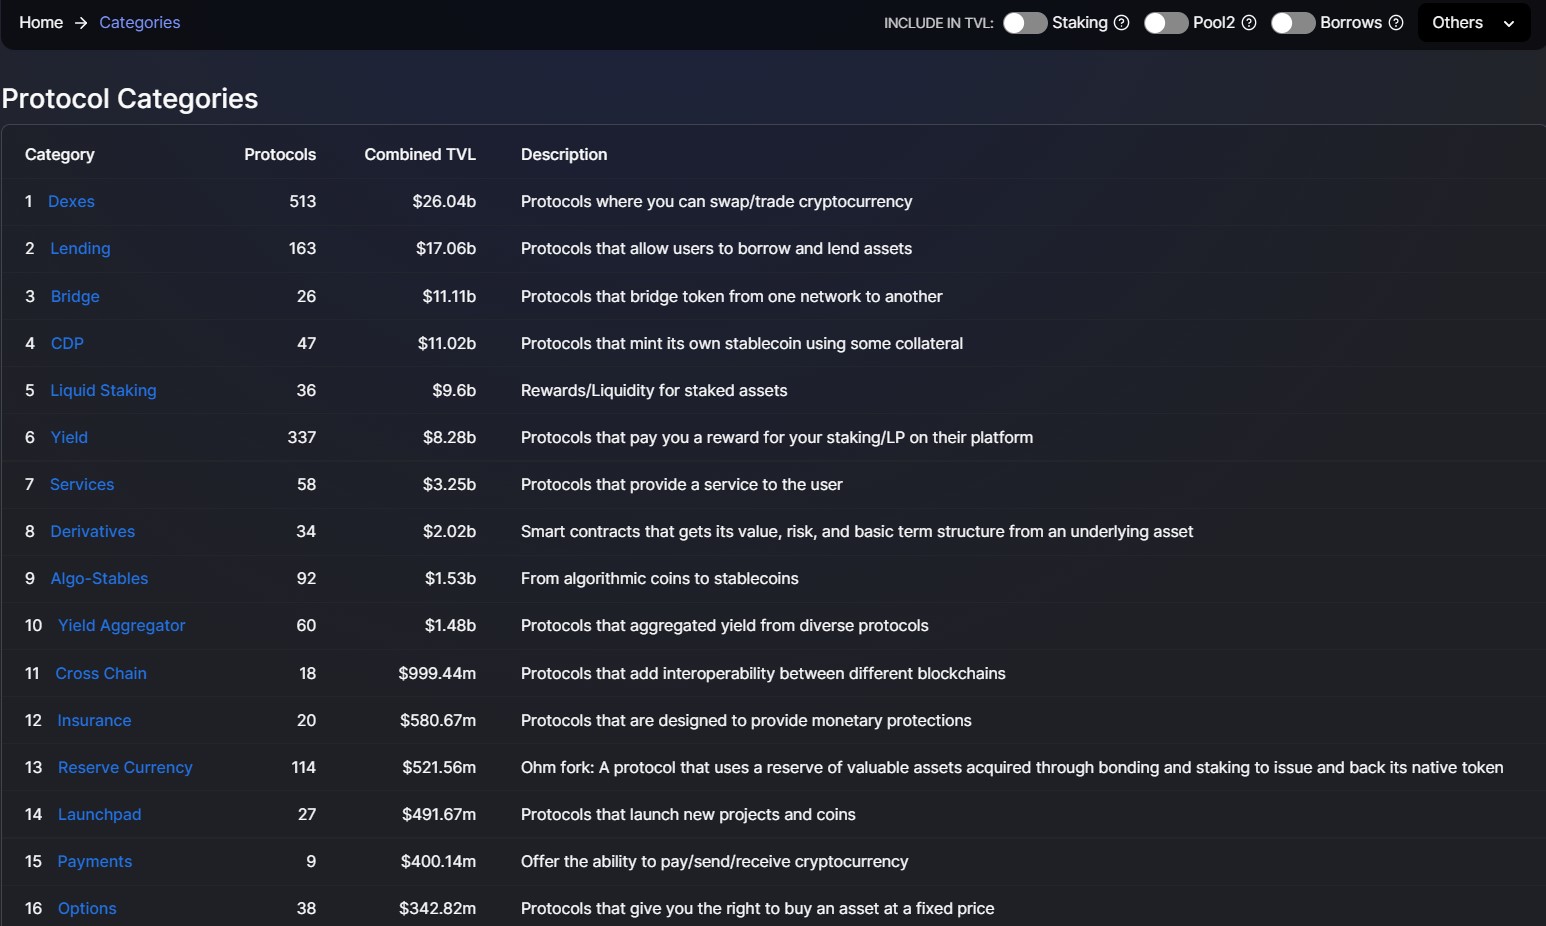
Categories
Check the list of different dApps (Protocol categories) and their basic description.
Recent
From this section, you can check the details of recently listed protocols.
Comparison
The Comparison tab lets you compare the price of Protocol A with the Mcap/TVL of Protocol B. You can enter the two protocols into the two fields, and DefiLama will calculate the price of protocol A concerning Protocol B.
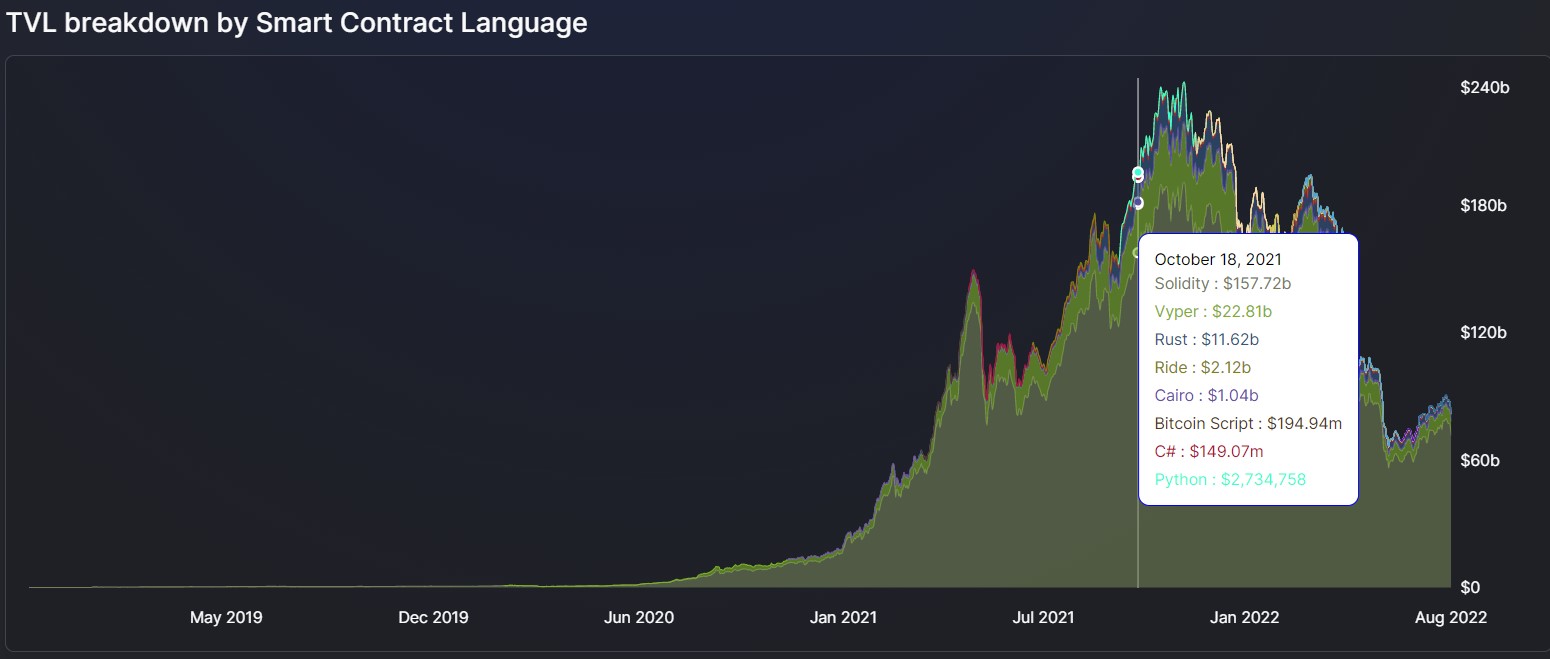
Language
Check the data of TVL breakdown based on different Smart Contract Language i.e Rust, Solidity, etc.
Conclusion
DefiLlama is a powerful analytics platform that integrates data from all existing blockchain protocols and presents it in a simple, understandable, and concise form to users. The platform is mainly suited for intermediate-level users and saves a lot of their time and effort in collecting and collating these details. You can get details at any level i.e Chain, dApps, oracles, etc.
- Get a $100 instant bonus with a first-time deposit of $50 within 7 days,
- Get a 20% trading fee discount for life!
- Get $200 worth of 2 months of Altcoin Buzz Access PRO Membership (50+ Trading Signals, Hidden Gems) and unlock up to $500 more in prizes
Binance Global
Binance US
For further details visit our special Binance Page. Terms & Conditions Apply.


