Chainlink LINK price is testing a critical moment: should you buy chainlink crypto right now?
Chainlink is climbing toward resistance with momentum building. Here's what happens next.

By Pratik OswalChief Technical Analyst
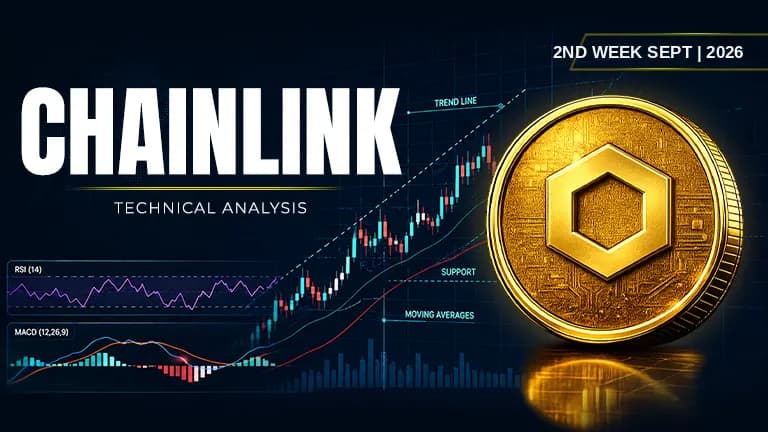
Asset | LINK (LINK/USDT) |
Price at Analysis | $12.58 |
Timeframe | Daily candle |
Date | September 9, 2026 |
Bias | BULLISH |
My Trade | Long: strong EMA stack above 200-day |
Cumulative Score | 6.1 / 10 |
200-day EMA | $9.08, price is above |
Bias Invalidation | $10.99 close below this level with volume would invalidate the bullish thesis |
Overview
Chainlink LINK price is currently trading at $12.58 on the daily timeframe, positioned well above its 200-day exponential moving average of $9.08 and sitting near its recent swing high of $13.68. The asset is roughly 8% below the cycle high, indicating we're in an uptrend zone but facing meaningful resistance overhead. The technical structure shows Chainlink crypto price supported by a strong foundation of moving averages, though the rally has not yet broken decisively into fresh territory.
The weight of evidence across the 10 indicators leans bullish with a cumulative score of 6.1 out of 10, driven by exceptionally strong EMA alignment, bullish Fibonacci positioning, and positive MACD momentum. However, this bullish narrative is tempered by weak support proximity, stacked resistance above, and concerning falling on-balance volume that suggests distribution is occurring even as price rallies. The Chainlink price action remains constrained in a relatively tight band, and breakout confirmation is the key variable for the next seven days.
RSI: Why is Chainlink (LINK) price rising despite overbought conditions?
The Relative Strength Index sits at 65.3, comfortably in the overbought zone above 70 is not yet reached, which means momentum is strong but not yet exhausted. This reading tells us that buyers are in control and actively pushing price higher, though the lack of an extreme overbought extreme reading (above 70) suggests there is still room for continuation. The RSI remains above the 50 midline, confirming that the underlying momentum bias remains squarely in the bullish camp for Chainlink price.
Score: 7.5 / 10 | Bullish
Moving Averages: Chainlink LINK price analysis and chart reveals perfect alignment
The exponential moving average structure is textbook bullish, with Chainlink price at $12.58 trading above the EMA 20 at $11.62, the EMA 50 at $10.44, the EMA 100 at $9.66, and decisively above the 200-day EMA at $9.08. This stacked alignment means the trend is unequivocally upward across all timeframes, and price is respecting the bullish technical structure. The fact that Chainlink (LINK) to USD sits nearly $3.50 above the 200-day average is a strong macro signal that the long-term trend remains intact, which is critical context for Chainlink price prediction 2026.
Score: 9 / 10 | Bullish
Bollinger Bands: Chainlink crypto price finds support in the upper half
The Bollinger Bands show Chainlink price at $12.58 trading between the mid-band at $11.80 and the upper band at $12.93, positioning the asset in the upper half of the volatility envelope. This placement indicates that price is toward the hot side of the bands but has not yet touched the upper edge, suggesting the move still has some elasticity left before a mean-reversion snap-back becomes likely. The lower band sits at $10.67, which would provide the first cushion if selling pressure emerges over the coming week.
Score: 7.5 / 10 | Bullish
Fibonacci Retracements: Chainlink LINK price is positioned between key recovery levels
Measuring from the swing low at $7.00 to the swing high at $13.68, Chainlink price at $12.58 is currently sitting between the 0.618 Fibonacci retracement at $11.13 and the 0.786 level at $12.25, having already reclaimed nearly 80% of the prior range. This positioning is bullish structurally because it shows strong mean-reversion has already occurred and price is now in the upper third of the recovery zone, which suggests Chainlink price prediction 2030 should start from an assumption of sustained strength. A close above $12.82 on the trendline would push Chainlink toward the $13.68 swing high target next.
Score: 9 / 10 | Bullish
Support Levels: Distance to safety zones raises risk on deeper pullbacks
Support levels are positioned at $10.99, $9.31, $8.75, and $8.07, meaning the nearest support is $1.59 below current price and would represent a 12.6% drawdown to reach. This distance is meaningful enough that I view the support structure as relatively weak in the immediate term; a break below $10.99 would leave significant air before the next cushion arrives. For Chainlink price analysis and chart perspective, this asymmetry between overhead resistance and deeper support levels is the key reason the cumulative score is moderate rather than strongly bullish.
Score: 3.5 / 10 | Bearish
Resistance: Chainlink LINK price faces a wall of overhead supply
Resistance zones sit at $12.60 (just 0.2% above current price) and at $13.68 (the recent swing high), creating a two-tier ceiling that will determine breakout viability. The $12.60 level is so close to current pricing that it will likely be tested within hours or the next trading session, and a failure to hold above it would signal weakness. If Chainlink price can clear both resistance zones decisively, the path opens toward $14 and beyond, but the stacked overhead supply makes this a high-friction zone for buyers.
Score: 3.5 / 10 | Bearish
Trendline: Chainlink price sits just below the ascending trend boundary
The ascending trendline is drawn at $12.82, meaning Chainlink price at $12.58 is currently $0.24 below the dominant uptrend line. This minor gap is meaningful because it means price is approaching but has not yet definitively reclaimed the trendline on a daily close basis. A daily close above $12.82 would be a technical confirmation signal that the uptrend is intact, whereas a failure to hold above this level would introduce ambiguity and warrant caution.
Score: 4 / 10 | Bearish
MACD: Chainlink crypto price momentum remains constructive above the signal line
The MACD line at 0.746626 is trading above the signal line at 0.718477, with a positive histogram reading of 0.028149 that confirms the momentum bar is green and growing. This configuration is textbook bullish because it shows the fast line has recently crossed above the slow line, which is the classic bullish signal for this oscillator. For Chainlink price prediction 2026 purposes, a widening histogram over the next few days would reinforce confidence in the rally, whereas a narrowing or turn negative would suggest momentum is fading.
Score: 8.5 / 10 | Bullish
On-Balance Volume: Chainlink LINK price rises while buyers are stepping back
On-balance volume is in a falling trend, which creates a divergence with Chainlink price moving higher and volume accumulation moving lower. This disconnect is a red flag because it suggests that while price is rallying, the underlying conviction among buyers is weakening and distribution may be occurring under the surface. A falling OBV during an uptrend often precedes pullbacks or range-breaks, making this the single most concerning technical signal in the current setup and explaining why support zones feel distant and weak.
Score: 3 / 10 | Bearish
Chart Patterns: No clear pattern formed, leaving next move ambiguous
The daily chart shows no clear candlestick pattern at this juncture, which means we lack a defined geometric structure (such as a triangle, wedge, or flag) that would normally telegraph the directional bias of the breakout. This lack of pattern clarity is neutral in its implications because it allows for movement in either direction without a strong predictive framework. The absence of a pattern also means that price action and volume behavior become even more critical to watch, since we cannot rely on classical pattern targets to project outcomes.
Score: 5 / 10 | Neutral
Indicator Scorecard
Indicator | Reading | Score / 10 |
|---|---|---|
RSI (14) | Elevated but not yet overbought; momentum trending up | 7.5 |
EMAs (20 / 50 / 100 / 200) | Perfect bullish stack; price well above all major moving averages | 9 |
Bollinger Bands | Upper half of envelope; room to upper band | 7.5 |
Fibonacci | Positioned between 0.618 and 0.786; strong recovery zone | 9 |
Support | Nearest at $10.99, a 12.6% drop away; insufficient cushion | 3.5 |
Resistance | Stacked at $12.60 and $13.68; immediate friction | 3.5 |
Trendline | $0.24 below ascending trendline; not yet confirmed on close | 4 |
MACD | Line above signal; positive histogram; momentum intact | 8.5 |
On-Balance Volume | Falling despite price rising; serious divergence signal | 3 |
Chart Patterns | No discernible pattern; neutral directional implication | 5 |
Cumulative Average | BULLISH bias: I'm going long | 6.1 |
My Trade: Going Long on LINK (Trendline break with strong EMA confluence)
I'm going long here because the cumulative score of 6.1 out of 10 is supported by an exceptionally strong moving average stack and bullish MACD momentum that outweigh the weakness in support and falling volume. My entry is positioned just above the current price, betting that Chainlink will reclaim the $12.82 trendline and push into the $13.68 swing high target. I'm risking the break of the $10.99 support level because that's where my bullish thesis would be invalidated by volume confirmation.
My entry zone | $12.58 – $12.82 |
My stop loss | $10.99 (support break with volume) |
My target 1 | $13.68: recent swing high and initial resistance |
My target 2 | $14.50: psychological round number and next structural level |
My target 3 | $15.25: extended Fibonacci projection from swing high |
Risk : Reward | 1 : 1.3 (T1) / 1 : 2.1 (T2) |
Position | Long / leveraged long |
When I Would Exit
I would exit my long position immediately if Chainlink price closes below $10.99 on elevated volume, because that break would signal that the support structure I'm relying on has failed and the moving average alignment is breaking down. My thesis is wrong if the OBV continues to fall despite price holding above $12.82, because that would confirm that distribution is more powerful than I anticipated and a pullback would be likely. I would also flip to neutral if price fails to hold the $12.60 resistance level for two consecutive daily closes, as that would suggest the near-term momentum is exhausted and mean-reversion is beginning. Is Chainlink a good long-term investment? Yes, but only if the long-term trend structure remains intact, which requires these near-term support levels to hold firm.
Disclaimer: This article is produced for informational and educational purposes only and does not constitute financial or investment advice. Cryptocurrency markets are highly volatile and carry significant risk. Always conduct your own research and consult a qualified financial adviser before making any trading decisions.

Pratik Oswal
An Electronics and Telecommunication Engineer with a strong foundation in analytical and quantitative thinking. I have authored seven books on Mathematics and have been actively involved in trading since 2012. Since 2017, I have been deeply engaged in the crypto ecosystem, gaining extensive experience across digital assets, markets, and emerging blockchain technologies. My background combines technical expertise, mathematical proficiency, and over a decade of hands-on experience in financial markets.
More from PratikNext up

ETH Sits on Its $2,444 Floor: Does the Old Low Hold Again?
ETH trades near $2,460, right on a $2,444 floor that has turned the price 14 times since late October 2024. Here are the levels a daily close would settle.
 ETH
ETH
Chainlink LINK price stuck in neutral: should you wait or move on?
 LINK
LINK
ETH Slips to a 30-Day Low and Rests on Its $2,358 Floor
ETH BTC
BTC
Hedera HBAR price stuck in limbo: what insiders are watching right now
XRP Sits Right at Its $1.36 Ceiling: Will Rises Stop There Again?
 XRP
XRP