SPX6900 SPX price is quietly building momentum: should you buy crypto now?
This altcoin is showing bullish signals that most traders cant see!

By Pratik OswalChief Technical Analyst
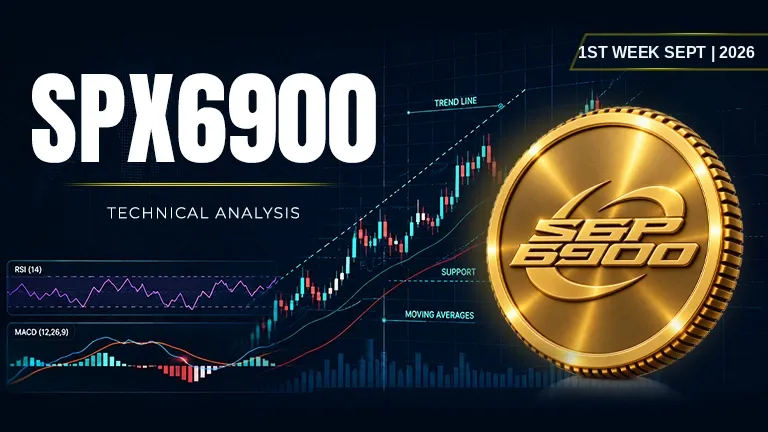
Asset | SPX (SPX/USDT) |
Price at Analysis | $0.55 |
Timeframe | Daily candle |
Date | September 7, 2026 |
Bias | BULLISH |
My Trade | Long: moving averages stacked bullishly |
Cumulative Score | 5.9 / 10 |
200-day EMA | $0.36, price is above |
Bias Invalidation | Break below $0.52 (20-day EMA support) with close below |
Overview
SPX6900 SPX price is currently trading at $0.55, a level that sits comfortably above multiple key moving averages and represents a structurally interesting position within the broader range established between the swing low of $0.27 and swing high of $0.68. The asset is trading $0.19 above its 200-day EMA, signalling that the macro trend remains constructive. Market structure suggests we're in the early-to-middle phase of a potential move higher, though momentum indicators are sending mixed signals about the urgency of that move.
Across the 10 core technical indicators, the weight of evidence favours the upside, even if the conviction is moderate rather than extreme. The moving average alignment is outstanding (9/10), with all four major EMAs in perfect bullish order and price above every single one. Fibonacci retracements show SPX6900 crypto price is positioned between the 0.5 and 0.618 levels, a zone historically associated with structural support and potential accumulation. However, falling on-balance volume and a negative MACD histogram introduce caution: volume is not yet confirming the price advance, and momentum is stalling. The cumulative score of 5.9/10 reflects this duality: strong structural setup, weaker momentum confirmation.
RSI: Momentum building but not yet overbought
The 14-period RSI is reading 58.8, which places it firmly in neutral-to-bullish territory without crossing into overbought conditions above 70. This reading sits just above the 50 midpoint, confirming that momentum is tilted to the upside but still has room to accelerate before hitting exhaustion. For SPX6900 SPX price, this setup is ideal: there is no imminent risk of a sharp pullback driven by overbought mean reversion, yet the indicator is actively showing that buyers have the upper hand.
Score: 6.5 / 10 | Bullish
Moving Averages: Why is SPX6900 (SPX) price rising? Four EMAs in perfect order
This is the strongest pillar of the bullish case for SPX6900 SPX price analysis and chart patterns. The 20-day EMA sits at $0.52, the 50-day at $0.45, the 100-day at $0.40, and the 200-day at $0.36, creating a textbook stacked formation that every bullish trader recognises instantly. Price at $0.55 is above all four of these levels, confirming that trend followers would all be holding long positions. The 200-day EMA at $0.36 is the macro foundation: as long as price remains above this level, the long-term trend remains intact and a major structural breakdown has not occurred.
Score: 9 / 10 | Bullish
Bollinger Bands: Volatility compression before the move
The Bollinger Bands show the upper band at $0.66, the middle band (20-day SMA) at $0.53, and the lower band at $0.39. SPX6900 price is currently trading just below the middle band, suggesting that volatility is moderate and price is not yet stretched to either extreme. The bands are relatively tight, which often precedes a volatility expansion. If momentum accelerates, we would expect price to test and potentially break above the upper band at $0.66, signalling that the next phase of the move is underway.
Score: 6 / 10 | Bullish
Fibonacci Retracements: Structural support zone ahead
Between the swing low of $0.27 and swing high of $0.68, the Fibonacci retracements create a scaffolding of key levels. SPX6900 (SPX) to USD conversion shows price is currently between the 0.5 retracement at $0.47 and the 0.618 at $0.52. This is a historically significant zone where buyers have historically defended price. The 0.236 level at $0.36 aligns perfectly with the 200-day EMA, creating a powerful double confluence point that would serve as a 'last stand' for the bull case. A move higher would target the 0.786 Fibonacci at $0.59, which also aligns closely with the ascending trendline.
Score: 8 / 10 | Bullish
Support Levels: Multiple cushions beneath price
The primary support zone is stacked at $0.52 (the 20-day EMA), followed by $0.36, and then $0.35 listed twice, suggesting this was a previous technical level tested multiple times. At current price of $0.55, the nearest support is just $0.03 below, which is tight but not alarming given the overall bullish setup. The strength of SPX6900 price prediction 2026 depends partly on whether these support levels hold through any near-term pullback. If price fails to hold $0.52, the next meaningful support is the 200-day EMA at $0.36, a level we would not want to see breached without significant fundamental deterioration.
Score: 4.5 / 10 | Neutral
Resistance: Clear targets for the upside move
Overhead resistance is defined at $0.65 and $0.68, with the latter representing the swing high from the recent range. These levels are not heavily stacked, which suggests that a clean move above $0.65 could accelerate into the swing high relatively quickly. For those considering whether to buy SPX6900 crypto, the path to $0.68 appears less congested than many altcoins face. A break above $0.68 would signal a new structural high and shift the entire risk/reward narrative further into the favour of continuation upside.
Score: 7 / 10 | Bullish
Trendline: Price slightly below the ascending trend
The dominant ascending trendline is currently sitting at $0.59, which means that price at $0.55 is trading slightly below this trend channel. This is a mild bearish divergence: an ascending trendline acts as a dynamic support for bull-biased moves, and price failing to maintain it suggests momentum may be losing steam. However, the trendline is only $0.04 away, meaning a modest intraday or next-day move could reestablish price above the trend. If price decisively closes below $0.59 for multiple days, it would be the first major structural warning sign.
Score: 4 / 10 | Bearish
MACD: Momentum is stalling, not yet reversing
The MACD line is at 0.054076 and the signal line is at 0.055926, meaning the signal is slightly above the line, creating a negative histogram of -0.001849. This is a barely negative reading, not a dramatic bearish divergence. What this tells us is that momentum may be losing upside acceleration, but it has not yet turned decisively negative. For the bullish thesis to remain valid through the next week, we need to see the MACD line cross back above the signal line and the histogram turn positive again. If the histogram continues to decline, it would confirm that momentum is genuinely fading.
Score: 4 / 10 | Bearish
On-Balance Volume: Distribution is a warning sign
On-balance volume is in a falling trend, which is the single most bearish piece of evidence in this analysis. While price is holding above key moving averages, volume is not confirming the upside, suggesting that professional accumulation may not be as aggressive as the price action alone would indicate. This divergence between price and volume is historically a precursor to either a pullback or a stall. For SPX6900 price prediction 2030 to play out as bullish, we would need to see OBV reverse course and start climbing alongside price. Until that happens, this indicator will remain a restraint on confidence.
Score: 3 / 10 | Bearish
Chart Patterns: Double bottom pattern signals reversal potential
A double bottom pattern is present in the chart, with the swing low of $0.27 formed twice (or near it). Double bottoms are classic reversal patterns that suggest price has found a bottom and is now ready to move higher. The measured target of a double bottom is typically the height of the pattern added to the breakout level, which in this case could project significantly higher. This pattern reinforces the bullish narrative and suggests that the low is in and a sustained recovery is underway.
Score: 6.5 / 10 | Bullish
Indicator Scorecard
Indicator | Reading | Score / 10 |
|---|---|---|
RSI (14) | Neutral-to-bullish, room to run | 6.5 |
EMAs (20 / 50 / 100 / 200) | Perfect bullish alignment, all below price | 9 |
Bollinger Bands | Tight bands, volatility expansion ahead | 6 |
Fibonacci | Price in key support zone at 0.5-0.618 | 8 |
Support | Multiple levels near but not close | 4.5 |
Resistance | Light supply above, path to $0.68 clear | 7 |
Trendline | Price slightly below ascending trend | 4 |
MACD | Line below signal, histogram barely negative | 4 |
On-Balance Volume | Falling trend, diverges from price | 3 |
Chart Patterns | Double bottom reversal pattern present | 6.5 |
Cumulative Average | BULLISH bias: I'm going long | 5.9 |
My Trade: Going Long on SPX (moving averages stacked bullishly)
I'm going long on SPX6900 here because the moving average stack is one of the cleanest I've seen in recent weeks, and the Fibonacci structure offers multiple layers of confluence support below me. With a cumulative score of 5.9/10, this isn't a high-conviction trade, but it's a mathematically sound setup where I'm risking a small amount to catch what could be a meaningful recovery move. My entry zone is between $0.54 and $0.56, right around the current price level, which gives me immediate definition on the upside with targets spaced at the resistance levels and the Fibonacci 0.786 point.
My entry zone | $0.54 – $0.56 |
My stop loss | $0.50 (below the 20-day EMA and nearest support) |
My target 1 | $0.65: resistance level 1 |
My target 2 | $0.68: swing high and resistance level 2 |
My target 3 | $0.79: Fibonacci 0.786 extension |
Risk : Reward | 1 : 3 (T1) / 1 : 5.8 (T3) |
Position | Long |
When I Would Exit
I would exit this trade immediately if price closes below $0.52, which is the 20-day EMA and my key support level. If that level breaks, it signals that the bullish structure I'm relying on has failed and momentum is reversing. My thesis is wrong if on-balance volume remains in a falling trend and price stalls below the trendline at $0.59 for more than three consecutive daily closes. Additionally, if the MACD histogram continues to decline and turns deeply negative while price is rising, that would be a classic bearish divergence that I cannot ignore. In any of those scenarios, I would close the position at a loss and reassess whether is SPX6900 a good long-term investment, or if structural damage has occurred.
Disclaimer: This article is produced for informational and educational purposes only and does not constitute financial or investment advice. Cryptocurrency markets are highly volatile and carry significant risk. Always conduct your own research and consult a qualified financial adviser before making any trading decisions.

Pratik Oswal
An Electronics and Telecommunication Engineer with a strong foundation in analytical and quantitative thinking. I have authored seven books on Mathematics and have been actively involved in trading since 2012. Since 2017, I have been deeply engaged in the crypto ecosystem, gaining extensive experience across digital assets, markets, and emerging blockchain technologies. My background combines technical expertise, mathematical proficiency, and over a decade of hands-on experience in financial markets.
More from PratikNext up

3 Altcoins to Watch in October’s Third Week 2026: AKE Unlock, Quack AI Futures and Monero's $600 Test
Akedo unlocks 2.11 billion AKE on Oct 21, Quack AI's rally ran on futures, and Monero retests the $600 to $635 zone. What decides each move.
 XMR
XMR
Chainlink LINK price stuck in neutral: should you wait or move on?
 LINK
LINK
Hedera HBAR price stuck in limbo: what insiders are watching right now
XRP Sits Right at Its $1.36 Ceiling: Will Rises Stop There Again?
 XRP
XRP
ETH Sits on Its $2,444 Floor: Does the Old Low Hold Again?
 ETH
ETH