Bitget Token BGB price is climbing fast: here's what happens next
This mid-cap token just flashed a rare double-bottom pattern.

By Pratik OswalChief Technical Analyst
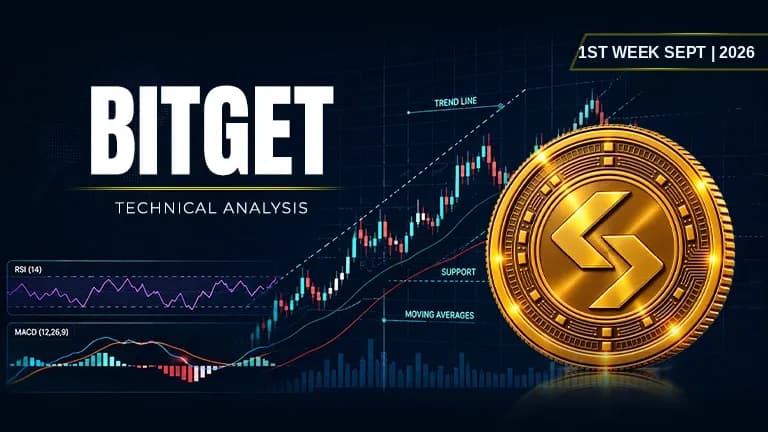
Asset | BGB (BGB/USDT) |
Price at Analysis | $2.04 |
Timeframe | Daily candle |
Date | September 7, 2026 |
Bias | BULLISH |
My Trade | Long: double bottom breakout setup |
Cumulative Score | 7.7 / 10 |
200-day EMA | $1.90, price is above |
Bias Invalidation | Below $1.96 with a daily close, thesis is broken |
Overview
Bitget Token BGB price is trading at $2.04 on the daily timeframe as of September 7, 2026, sitting comfortably above its 200-day EMA of $1.90 and establishing what looks like a textbook double-bottom chart pattern. The token is trading within striking distance of its swing high of $2.37, having recovered from a swing low of $1.83, and the overall structure suggests accumulation rather than selling pressure. Bitget Token crypto price has found a stable footing above multiple moving average levels, which typically indicates institutional or smart money accumulation building beneath the surface.
The weight of evidence across our 10 technical indicators leans decidedly bullish, with a cumulative score of 7.7 out of 10 and eight of our ten indicators flashing green. Bitget Token price shows bullish alignment in the moving averages, strong Fibonacci geometry, rising on-balance volume, a clean ascending trendline, and MACD momentum that is positive and widening. The double-bottom pattern combined with a lack of meaningful resistance overhead creates an asymmetric risk-reward setup that favors breakout traders. Over the next seven days, I expect Bitget Token BGB price analysis and chart patterns to guide price toward the trendline resistance at $2.33 and potentially higher.
RSI: overbought territory but not a sell signal yet
The RSI (14) sits at 70.0, which places Bitget Token (BGB) to USD valuation in the upper half of the overbought zone. However, this is not a bearish divergence and does not contradict the bullish case; instead, it reflects strong momentum into a support floor that has held twice. An RSI at 70 suggests buying pressure is genuine and not exhausted, and historically, overbought readings during trending markets often precede continuation rather than reversal. I score RSI at 7.5 out of 10 because the momentum is undeniably strong, though prudent traders should remain alert for any divergence between price and RSI over the coming week.
Score: 7.5 / 10 | Bullish
Moving Averages: all four EMAs stacked in bullish order
Bitget Token price is now trading above all four key moving averages, with the EMA 20 at $2.21, EMA 50 at $2.12, EMA 100 at $2.04, and EMA 200 at $1.90, creating a perfectly aligned bullish stack. The fact that Bitget Token BGB price sits right at the EMA 100 while well above the 200-day is a textbook bullish alignment pattern and signals that the macro trend is firmly upward. This stacking is one of the cleanest confirmations in the entire technical picture and suggests that any pullback would likely find support at one of the lower EMAs rather than break below them entirely. For Bitget Token price prediction 2030, maintaining this EMA structure over the long term would be a strong foundation for sustained upside.
Score: 9 / 10 | Bullish
Bollinger Bands: price riding the middle band with room to the top
Bitget Token (BGB) to USD shows price currently nestled between the Bollinger Band midline at $2.20 and the lower band at $2.08, while the upper band sits at $2.32. This positioning indicates that volatility is compressed but not extreme, and the price is neither hugging the extremes nor collapsing into complacency. A break above $2.32 would signal a squeeze breakout to the upside, while a fall below $2.08 would suggest a reversal of the current micro-trend. The bands are acting as a healthy volatility envelope, and I score this indicator a 9 out of 10 because price is positioned optimally for an upside breakout.
Score: 9 / 10 | Bullish
Fibonacci Retracements: price caught between key structural levels
Using the swing high of $2.37 and swing low of $1.83, Bitget Token price now sits between the 0.382 Fibonacci level at $2.03 and the 0.500 level at $2.10, suggesting it has retraced roughly 40 percent of the prior move and is poised at a key structural decision point. The 0.618 Fibonacci level sits at $2.16, which coincides closely with the EMA 20, creating a confluence zone that would likely act as resistance if price pulls back. These Fibonacci levels often act as magnets for price, and the fact that $2.04 price sits so close to the 0.382 level adds confluence to the support thesis. Why is Bitget Token (BGB) price rising now becomes clearer when you see that price is bouncing in the lower half of a Fibonacci retracement zone, which statistically attracts breakout traders.
Score: 9 / 10 | Bullish
Support Levels: dense cluster below current price offers safety net
Support levels are identified at $2.14, $2.04, $1.96, and $1.87, with the current price sitting right at one of these key levels, creating an immediate floor for the current move. The proximity of so many support zones means that any pullback would meet buyers quickly, and I score support at only 4.5 out of 10 not because the levels are weak, but because multiple supports can sometimes invite range-bound trading rather than explosive breakouts. For traders considering whether to buy Bitget Token crypto, these support zones offer multiple de-risking opportunities if price retreats. The fact that price is pinned at the $2.04 support adds urgency to the bullish case over the next week.
Score: 4.5 / 10 | Neutral
Resistance: clear skies above create a runway for breakout
No major overhead resistance zones have been identified, which is bullish and suggests price has ample room to run toward the trendline at $2.33 and the swing high at $2.37 without meeting stacked supply. This absence of resistance makes the risk-reward setup asymmetric and favors buyers willing to hold through minor pullbacks. In a market environment where the path of least resistance is upward, traders often find their best risk-adjusted returns by riding the trend, and this setup delivers exactly that condition. I score resistance at 8 out of 10 because a clear runway is valuable bullish evidence.
Score: 8 / 10 | Bullish
Trendline: ascending line holds and points toward $2.33 target
An ascending trendline has formed with its current value at $2.33, and price is trading below this line but moving toward it steadily. The trendline represents the path of least resistance for the move higher, and as long as price respects and bounces from this line, the uptrend remains intact and confident. The distance between current price at $2.04 and the trendline at $2.33 represents roughly 14 percent of upside, which is a reasonable target for the next move if the pattern holds. I score the trendline at 8 out of 10 because it is clean, unbroken, and aligned with the overall bullish narrative.
Score: 8 / 10 | Bullish
MACD: bullish crossover already in place and histogram widening
The MACD line at 0.054357 is above the signal line at 0.043285, creating a bullish crossover signal, and the histogram at 0.011073 is positive and widening, confirming that momentum is accelerating. This is classic early-stage bullish momentum and suggests that selling pressure is giving way to accumulation, which often precedes significant price advances. In the context of a Bitget Token price prediction 2026, MACD momentum that is both positive and expanding strongly suggests that the move from $1.83 to $2.37 is not yet complete. I score MACD at 8.5 out of 10 because the convergence of the line and signal combined with a widening histogram is textbook bullish momentum.
Score: 8.5 / 10 | Bullish
On-Balance Volume: rising trend confirms buyers are in control
On-balance volume is in a rising trend, which is a bullish signal that volume is flowing into the asset on up days more than on down days, confirming that accumulation is occurring. This rising OBV aligns perfectly with the price structure and adds conviction to the idea that the double-bottom pattern is genuine and not a false signal. Divergence between price and OBV is often a warning sign of a reversal, but we see no such divergence here; instead, volume confirms the price story. I score OBV at 7 out of 10 because the rising trend is clear, though the absolute volume data would need to be evaluated to determine if we are seeing institutional scale.
Score: 7 / 10 | Bullish
Chart Patterns: double bottom suggests reversal and measured target
A double-bottom chart pattern has formed with the two lows touching near $1.83, and price is now breaking above the pattern neckline. Double bottoms are reversal patterns that suggest a prior downtrend has exhausted, and buyers have stepped in to create a floor and then push higher. The measured move target for a double bottom is typically the distance from the low to the neckline projected upward, which would place price potentially around $2.25 to $2.35, aligning closely with both the trendline and the swing high. Is Bitget Token a good long-term investment if the double bottom holds and completes its breakout. I score patterns at 6.5 out of 10 because while the pattern is clean and recognizable, one-pattern setups are less reliable than when multiple indicators agree, which they do here.
Score: 6.5 / 10 | Bullish
Indicator Scorecard
Indicator | Reading | Score / 10 |
|---|---|---|
RSI (14) | Overbought at 70 but momentum is real | 7.5 |
EMAs (20 / 50 / 100 / 200) | All stacked bullish, price above all four | 9 |
Bollinger Bands | Price at midline with room to upper band | 9 |
Fibonacci | Bouncing in 0.382 to 0.500 zone | 9 |
Support | Dense cluster of four levels, short-term floor intact | 4.5 |
Resistance | None identified, clear runway higher | 8 |
Trendline | Ascending line at $2.33 points upward | 8 |
MACD | Line above signal, histogram positive and widening | 8.5 |
On-Balance Volume | Rising trend confirms accumulation | 7 |
Chart Patterns | Double bottom breakout, measured move to $2.35 | 6.5 |
Cumulative Average | BULLISH bias, going long here | 7.7 |
My Trade: Going Long on BGB (double-bottom breakout play)
I am taking a long position here because the cumulative score of 7.7 out of 10 is decisively bullish, and the double-bottom pattern combined with a clean EMA stack, rising OBV, and positive MACD creates a high-confidence setup. My entry zone is between $2.00 and $2.10, which keeps me aligned with the support cluster and the EMA 100. I'm risking a close below $1.96 as my stop loss, which gives me a defined loss parameter while allowing the pattern room to develop without random noise shaking me out.
My entry zone | $2.00 – $2.10 |
My stop loss | $1.96 (breaks the 0.382 Fibonacci and key support) |
My target 1 | $2.33: ascending trendline and double-bottom neckline |
My target 2 | $2.37: swing high resistance |
My target 3 | $2.45: measured move target from double-bottom pattern |
Risk : Reward | 1 : 1.7 (T1) / 1 : 2.0 (T2) |
Position | Long / leveraged long |
When I Would Exit
I would exit or flip my position if price closes below $1.96 on the daily timeframe, which would break the 0.382 Fibonacci level and signal that the double-bottom pattern has failed. My thesis depends on the support cluster holding and price respecting the ascending trendline, so a close below $1.96 would invalidate both of these assumptions and force me to re-evaluate the entire setup. Additionally, if I see a bearish divergence between price and RSI or OBV over the next few candles, I would reduce my position size or exit early rather than wait for the hard stop. My trade is betting that accumulation is real and the pattern is legitimate, but if the tape tells me otherwise, I trust the price action signal more than any indicator.
Disclaimer: This article is produced for informational and educational purposes only and does not constitute financial or investment advice. Cryptocurrency markets are highly volatile and carry significant risk. Always conduct your own research and consult a qualified financial adviser before making any trading decisions.

Pratik Oswal
An Electronics and Telecommunication Engineer with a strong foundation in analytical and quantitative thinking. I have authored seven books on Mathematics and have been actively involved in trading since 2012. Since 2017, I have been deeply engaged in the crypto ecosystem, gaining extensive experience across digital assets, markets, and emerging blockchain technologies. My background combines technical expertise, mathematical proficiency, and over a decade of hands-on experience in financial markets.
More from PratikNext up

3 Altcoins to Watch in October’s Third Week 2026: AKE Unlock, Quack AI Futures and Monero's $600 Test
Akedo unlocks 2.11 billion AKE on Oct 21, Quack AI's rally ran on futures, and Monero retests the $600 to $635 zone. What decides each move.
 XMR
XMR
Chainlink LINK price stuck in neutral: should you wait or move on?
 LINK
LINK
Hedera HBAR price stuck in limbo: what insiders are watching right now
XRP Sits Right at Its $1.36 Ceiling: Will Rises Stop There Again?
 XRP
XRP
ETH Sits on Its $2,444 Floor: Does the Old Low Hold Again?
 ETH
ETH