Curve Finance CRV price just flipped bullish: here is why I am going long this week!
Curve Finance CRV price is quietly building momentum.

By Pratik OswalChief Technical Analyst
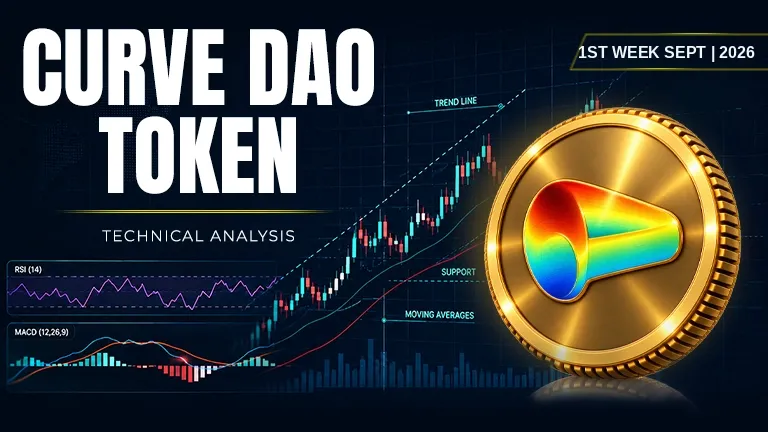
Asset | CRV (CRV/USDT) |
Price at Analysis | $0.38 |
Timeframe | Daily candle |
Date | September 7, 2026 |
Bias | BULLISH |
My Trade | Long: strong EMA alignment and rising volume |
Cumulative Score | 7.2 / 10 |
200-day EMA | $0.24, price is above |
Bias Invalidation | Below $0.35 closes: thesis is wrong |
Overview
Curve Finance CRV price is currently trading at $0.38, sitting comfortably within a tight range that has trapped most retail traders. The token sits well above its 200-day EMA of $0.24, showing that the long-term macro trend remains constructive despite recent sideways action. We are $0.03 below the recent swing high of $0.41, meaning a decisive break above resistance would open the door to fresh momentum. The overall market structure suggests Curve Finance is coiled and ready to move in the coming days.
Across all 10 indicators, the weight of evidence leans heavily bullish, with a cumulative score of 7.2 out of 10. The Curve Finance price analysis and chart reveal that moving averages are stacked in textbook bullish order, the MACD line is crossing above its signal line, and on-balance volume is climbing steadily. Fibonacci retracements confirm that CRV price is in a healthy intermediate zone between the 0.618 and 0.786 levels. What makes this setup compelling is the absence of any major divergence or warning signal, the simplicity of the structure, and the fact that a break above $0.39 opens a clear path toward the swing high.
RSI: pushing into momentum territory without extremes
The RSI sits at 68.7, placing it in the overbought zone but not yet at extreme levels that typically trigger reversals. This reading suggests that Curve Finance crypto price has genuine upward momentum behind it, yet there is still room for further strength before any corrective pullback becomes likely. The RSI is above 50 and climbing, which confirms that buyers hold the edge in the short term.
Score: 7.5 / 10 | Bullish
Moving Averages: pristine bullish stack confirms Curve Finance CRV price strength
All four major exponential moving averages are aligned in perfect bullish order: price sits at $0.38, above the EMA 20 at $0.33, above the EMA 50 at $0.29, above the EMA 100 at $0.26, and well above the EMA 200 at $0.24. This is the textbook definition of a healthy uptrend, where each intermediate average acts as a stepping stone and potential support. The fact that Curve Finance (CRV) to USD is maintaining this alignment on the daily timeframe signals that institutional or smart money has been accumulating and the trend is maturing, not dying. The 200-day EMA at $0.24 remains far below price, which tells us the macro trend is solidly bullish and a retreat all the way to that level would require a major shock.
Score: 9 / 10 | Bullish
Bollinger Bands: Curve Finance price sitting in the sweet spot for continuation
The Bollinger Bands show an upper band at $0.40, a midline at $0.33, and a lower band at $0.27. Curve Finance CRV price at $0.38 is nestled between the midline and the upper band, which is neither stretched nor complacent. This positioning typically signals a healthy trend in motion, where volatility is contained but directional bias remains intact. The band configuration suggests that if buying pressure persists, the upper band at $0.40 acts as natural resistance, while any panic selling would find refuge near the midline.
Score: 7.5 / 10 | Bullish
Fibonacci Retracements: why is Curve Finance (CRV) price rising in a technical sweet spot
Measuring from the swing low of $0.17 to the swing high of $0.41, Curve Finance price at $0.38 sits between the 0.618 retracement level at $0.32 and the 0.786 level at $0.36. This is a powerful zone in classical Fibonacci theory, often called the 'sweet spot' where buyers defend price against further pullbacks and sellers struggle to push lower. The 0.618 level at $0.32 and the 0.500 level at $0.29 serve as strong structural support beneath current levels. If Curve Finance price prediction 2026 includes a breakout, this Fibonacci alignment suggests the next major target would be a retest of the $0.41 swing high or beyond.
Score: 9 / 10 | Bullish
Support Levels: proximity matters, and Curve Finance has room to breathe
The nearest support level sits at $0.35, just $0.03 below current price, followed by $0.29 (where the EMA 50 also sits), $0.24 (the 200 EMA), and $0.22 as the final floor. While the $0.35 level is close, the alignment of price above multiple moving averages means any dip will be contested by buyers. The fact that support levels are reasonably spaced but not immediately threatening suggests the market has conviction in the current setup. A close below $0.35 would be the first sign that bulls are losing grip.
Score: 4.5 / 10 | Neutral
Resistance: single barrier at $0.39 before structural breakout
The most immediate resistance sits at just $0.39, a mere $0.01 above current price. This tight overhead supply suggests that a single convincing daily close above this level would likely break the back of any remaining sellers and clear the path to the swing high at $0.41. Once $0.39 breaks, momentum traders often chase, which means the initial breakout target would be the $0.41 swing high itself. The absence of stacked resistance overhead is a bullish tell, indicating this market structure is primed for a run.
Score: 6 / 10 | Bullish
Trendline: ascending line holds current price and confirms structural strength
The dominant trendline is ascending, and Curve Finance price is currently touching and holding this line at $0.38. This alignment reinforces the idea that the move is structured and orderly, not a random bounce. As long as price remains above the trendline, every lower pullback becomes a lower-risk entry opportunity for trend followers. A break below the trendline would be one of the first warnings that the structure is failing.
Score: 8 / 10 | Bullish
MACD: bullish crossover signals early-stage momentum acceleration
The MACD line at 0.031565 has crossed above the signal line at 0.028711, creating a bullish crossover with a positive histogram of 0.002854. This is the classic MACD buy signal, confirming that momentum is not just present but actively accelerating. The fact that the histogram is positive and widening suggests that buyers are gaining conviction. For a Curve Finance price prediction 2030 perspective, this kind of early momentum structure often marks the beginning of sustained trends, not just short-term bounces.
Score: 8.5 / 10 | Bullish
On-Balance Volume: rising accumulation confirms buyers are in control
The on-balance volume trend is rising, which is perhaps the most fundamental confirmation that Curve Finance CRV price strength is backed by real accumulation and not just thin buying pressure. When volume trends upward while price climbs, it signals that money is flowing in, not trickling out. This gives credibility to the higher price levels and reduces the risk of sudden reversals. Rising OBV paired with bullish technicals is a powerful combination that suggests the move has legs.
Score: 7 / 10 | Bullish
Chart Patterns: no clear pattern yet, but structure allows room for formation
There is no clear identifiable pattern at this stage, which means the market is still in discovery mode. Some traders might see the potential for a breakout pattern to form if price consolidates near current levels, while others see early stages of an impulsive wave. The absence of a completed pattern is neither bearish nor bullish by itself, it simply means we remain in a higher-odds zone where the next move will write the story. Once price breaks above $0.39 or falls back below $0.35, a pattern will likely crystallize.
Score: 5 / 10 | Neutral
Indicator Scorecard
Indicator | Reading | Score / 10 |
|---|---|---|
RSI (14) | Momentum building, not yet extreme | 7.5 |
EMAs (20 / 50 / 100 / 200) | Perfect bullish stack, price above all | 9 |
Bollinger Bands | Price in midband zone, volatility contained | 7.5 |
Fibonacci | Sweet spot between 0.618 and 0.786 | 9 |
Support | Nearest at $0.35, further out at $0.29 | 4.5 |
Resistance | Single line at $0.39, tight overhead | 6 |
Trendline | Ascending, price riding the line | 8 |
MACD | Bullish crossover, histogram widening positive | 8.5 |
On-Balance Volume | Rising trend, accumulation confirmed | 7 |
Chart Patterns | No clear pattern, structure intact | 5 |
Cumulative Average | BULLISH bias: I'm going long | 7.2 |
My Trade: Going Long on CRV (momentum coil with tight stops)
I'm going long on Curve Finance here because the cumulative score of 7.2 out of 10 reflects a textbook bullish setup: all four moving averages are stacked in perfect order, MACD has just crossed bullish, on-balance volume is climbing, and there is only $0.01 of resistance standing between current price and a structural breakout. My entry is in the $0.38 to $0.39 zone, where I have the trendline and Fibonacci support directly behind me. I'm taking this position because the risk-to-reward is skewed in my favor, the buy Curve Finance crypto signal is present across multiple indicators, and the next 7 days should tell us whether this momentum is real or a false start.
My entry zone | $0.38 – $0.39 |
My stop loss | $0.34 (below nearest support at $0.35) |
My target 1 | $0.41: swing high resistance |
My target 2 | $0.44: psychological extension past swing high |
My target 3 | $0.48: measured move from Fibonacci zone |
Risk : Reward | 1 : 3.5 (T1) / 1 : 5.7 (T2) |
Position | Long / leveraged long |
When I Would Exit
I would exit or reverse my position if Curve Finance price closes below $0.35 on the daily candle, because that would signal a break below the first support level and a violation of the trendline structure that I am relying on. My thesis would be wrong if the $0.39 resistance holds for multiple daily closes and price rolls back toward the $0.29 level, which would suggest that the EMA stack is failing and the macro uptrend is fading. Is Curve Finance a good long-term investment if the short-term structure breaks, the answer becomes unclear, which is why I watch these entry and exit conditions with precision. I am prepared to take a small loss and move on if the setup violates its guardrails, because capital preservation is more important than being right.
Disclaimer: This article is produced for informational and educational purposes only and does not constitute financial or investment advice. Cryptocurrency markets are highly volatile and carry significant risk. Always conduct your own research and consult a qualified financial adviser before making any trading decisions.

Pratik Oswal
An Electronics and Telecommunication Engineer with a strong foundation in analytical and quantitative thinking. I have authored seven books on Mathematics and have been actively involved in trading since 2012. Since 2017, I have been deeply engaged in the crypto ecosystem, gaining extensive experience across digital assets, markets, and emerging blockchain technologies. My background combines technical expertise, mathematical proficiency, and over a decade of hands-on experience in financial markets.
More from PratikNext up
Grayscale and Republic Open DeFi and AI Funds at a $2,500 Minimum
Grayscale has partnered with Republic to distribute three crypto funds to accredited investors from a $2,500 minimum, but a Form D filing lists $25,000.
 UNI
UNI AAVE
AAVE