AltcoinBuzzAltcoinBuzz
Subscribe
  • Crypto News
  • Crypto Research
  • Technical Analysis
AltcoinBuzzAltcoinBuzz

An independent digital media outlet delivering crypto research, news, and technical analysis to a community of 600,000+ users.

Follow us on:

Discover

  • Crypto Research
  • Crypto News
  • Technical Analysis
  • Key Opinions
  • Upcoming Launches

Categories

  • Bitcoin BTC
  • RWA
  • Technology
  • Altcoins
  • Regulation

Company

  • Affiliates
  • Partners & Sponsors
  • Careers
  • Contact
  • Terms of Use
  • Subscription Terms
  • About the ALTCOIN BUZZ
  • Privacy Policy
  • Contact ALTCOIN BUZZ
  • Advertise with us

Copyright 2026 ALTCOIN BUZZ. All rights reserved.Something is buzzzzzzzing.
HomeCrypto ResearchSolana Beats Ethereum in Fees, but ETH Still Leads in Burns
Crypto ResearchEthereum ETHAltcoins

Solana Beats Ethereum in Fees, but ETH Still Leads in Burns

Solana took more user fees than Ethereum on DefiLlama's Sept. 22 snapshot, but its reported burn ran lower. The gap runs through fee design, not volume.
SSaloni Rathi•Sep 23, 2026
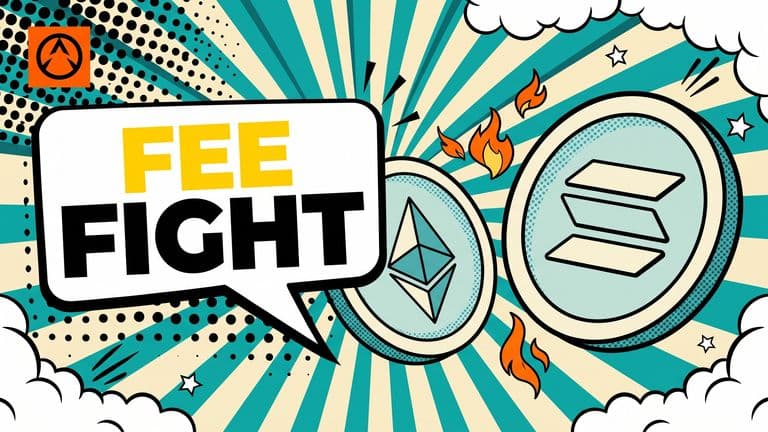
A pop-art comic cover showing a large Solana coin on the right and a smaller Ethereum coin on the left, with small flame shapes between them and a headline reading FEE FIGHT.
MentionedSOL$117.52+0.75%ETH$2,735.05-0.24%

Solana generated more user fees than Ethereum in DefiLlama's September 22 snapshot. Ethereum, however, still burned slightly more fees over the longer term.

The difference shows why higher network fees do not automatically mean more tokens are removed from supply or better returns for holders.

Solana Takes the Fee Lead

DefiLlama's 24-hour snapshot showed Solana with about $1.1 million in chain fees, compared with $649,423 for Ethereum.

Solana also led over longer periods. Its 30-day chain fees reached about $23.6 million, nearly twice Ethereum's $12 million.

But Ethereum remained ahead in reported burns.

Over 30 days, Ethereum burned about $2.8 million, compared with $2.66 million for Solana. The difference was much wider in the daily snapshot, with Ethereum reporting about $226,298 in revenue against Solana's $117,138.

These figures show that fee generation and token burning are not the same thing.

Why Solana's Higher Fees Do Not Mean Higher Burns

The difference comes partly from how each network handles fees.

On Solana, the base fee is 5,000 lamports per signature. Half of that fee is burned, while the other half goes to the validator producing the block.

Priority fees work differently. Users pay them to have transactions processed faster, and the validator receives the full priority fee.

That means Solana can generate large fee totals without sending the same share of that money toward token burning.

Ethereum burns its execution base fees, while priority tips go to validators. DefiLlama's Ethereum data also includes blob fees in its reported fees and burns.

So, two networks can collect similar amounts from users while producing very different burn figures.

The Burn Gap Is Smaller Than It Looks

Over 30 days, the reported burns were surprisingly close.

Solana's $2.66 million burn was only about $140,000 below Ethereum's $2.8 million, despite Solana generating nearly twice as many chain fees.

The difference becomes more interesting when network size is considered.

DefiLlama's September 22 snapshot showed Ethereum with a market capitalization of about $335 billion, compared with roughly $69 billion for Solana.

That means similar dollar amounts of reported burns represent very different shares of the two networks displayed market values.

However, burn figures alone cannot determine whether either asset is becoming deflationary. New token issuance also needs to be considered, and the snapshot did not provide current issuance figures for both networks.

Solana Leads in App Activity Too

The fee gap becomes wider when looking at applications.

DefiLlama's 24-hour overview showed about $7.7 million in app revenue on Solana, compared with $1.9 million on Ethereum.

App fees were also higher on Solana at about $18.2 million, compared with $8.5 million on Ethereum.

These figures measure activity at the application level rather than simply the fees paid to the underlying blockchain.

DefiLlama also uses a broader measure called chain REV, which includes chain fees and maximum extractable value (MEV) tips. But adding REV to chain fees would double-count some of the same fees, according to the dashboard's definitions.

What the Numbers Do Not Tell Us

The comparison comes with several data limits.

DefiLlama's Solana adapter estimates base fees by multiplying transaction counts by 5,000 lamports, although Solana charges that base fee per signature rather than per transaction.

For Ethereum, DefiLlama's adapter uses each block's minimum effective transaction gas price as a proxy for the execution base fee and obtains blob fees separately from Dune.

The dashboard also showed a separate Ethereum daily burn figure of $229,846, compared with $226,298 on the main overview. The page attributed the difference to synchronization limits between DefiLlama tables.

The exact endpoints for the displayed 24-hour, seven-day and 30-day periods were also not disclosed.

That means these figures are best treated as the displayed DefiLlama aggregates rather than perfectly reconciled measurements.

Higher Fees Do Not Automatically Pay Holders

Another important distinction is between network fees, burns and staking rewards.

Burning tokens reduces supply relative to what it otherwise would have been. It does not put money into a holder's wallet or guarantee that the token price will rise.

Similarly, higher validator revenue does not automatically mean every SOL or ETH holder receives that income.

On Solana, staking rewards depend on factors including total stake, validator performance and commissions. Jito also introduced infrastructure allowing validators to distribute priority fees to stakers, but the amount reaching delegators depends on individual validator arrangements.

For a passive holder, higher network fees alone do not create a direct payment.

Solana Leads Fees, Ethereum Leads Burns

The September 22 snapshot gives a clear split: Solana leads in reported user fees and application activity, while Ethereum retains a slight lead in reported 30-day burns.

That does not establish which network has better economics for holders.

Fee generation, token burning, validator income, staking rewards, issuance and network value measure different parts of each ecosystem.

For SOL and ETH holders, the more useful question is therefore not simply which chain collects more fees. It is how those fees are distributed, how much supply is issued, and what portion of the network's economic activity ultimately reaches the asset itself.

The information discussed by Altcoin Buzz is not financial advice. This is for educational, entertainment, and informational purposes only. Any information or strategies are thoughts and opinions relevant to the accepted levels of risk tolerance of the writer/reviewers and their risk tolerance may be different than yours. We are not responsible for any losses that you may incur as a result of any investments directly or indirectly related to the information provided. Bitcoin and other cryptocurrencies are high-risk investments so please do your due diligence.

Copyright Altcoin Buzz Pte Ltd.

Related

A bold pop-art cover showing a Bitcoin coin and a Strategy stock badge tumbling down a steep red bar chart, paired with the headline BTC STOCKS CRASH and a -52% badge.
Bitcoin BTC
Sep 23, 2026

Bitcoin Treasury Stocks Lose Ground as the 2025 Boom Fades

The median 18-month return for the top 20 non-mining bitcoin treasury stocks is roughly negative 18%, while BTC itself is up less than 3%.

BTC
Saloni Rathi
Pop-art comic cover: a large Bitcoin coin tips off balance on the right while a crowd of smaller altcoin coins climbs an upward arrow on the left, beneath a speech bubble reading DOMINANCE STALLS.
AltcoinsBitcoin BTC
Sep 22, 2026

Glassnode Flags Altseason as Bitcoin Dominance Stalls below 60%

Glassnode's Altcoin Cycle Signal printed a new altseason reading at 81.25 as Bitcoin dominance stalled under 60%. Altcoin market cap is up 33% since Aug 19.

BTC

Anmol Billa
A pop-art comic cover with a speech bubble reading 'THREE UNLOCKS TO WATCH' and three cracked cartoon coins of decreasing size, tagged with the Plasma, Humanity and SoSoValue logos, hovering over a calendar marked 24 and 25.
AltcoinsStablecoins
Sep 21, 2026

3 Token Unlocks to Watch This Week, September 2026

Plasma's $160M XPL unlock leads a $900M week of token releases on Sept 24-25, 2026.

XPLH+1 more
Saloni Rathi