Zcash is surging toward key resistance, yet momentum indicators are starting to crack.
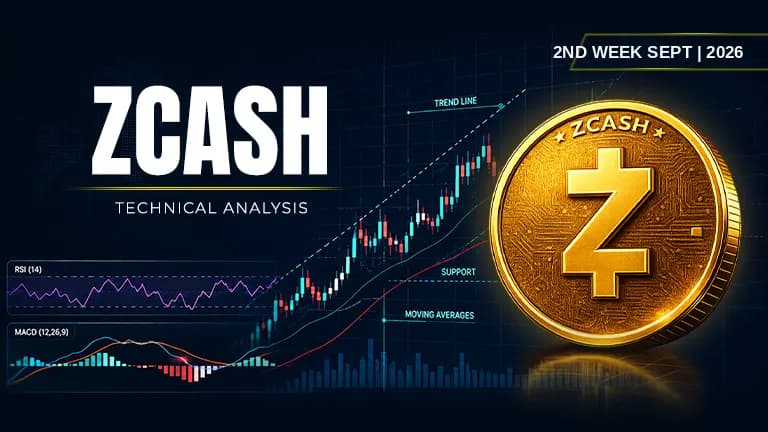
 ZEC$1,137.61+1.88%
Asset | ZEC (ZEC/USDT) |
Price at Analysis | $1,134.54 |
Timeframe | Daily candle |
Date | September 14, 2026 |
Bias | BULLISH |
My Trade | Long on strong EMA structure |
Cumulative Score | 6.3 / 10 |
200-day EMA | $485.67, price is above |
Bias Invalidation | Close below $1,054.58 support with volume |
Zcash (ZEC) to USD is currently trading at $1,134.54, positioned well above its long-term moving averages and roughly 133% above its 200-day EMA of $485.67. The Zcash ZEC price has climbed significantly from its swing low of $361.48, placing it within striking distance of the swing high near $1,295.83. The overall market structure is bullish, with price nestled comfortably in the upper half of the broader trading range established since the low point.
The Zcash price has benefited from strong alignment of exponential moving averages, with the 20-day EMA at $1,004.86 well above the 50-day at $813.50 and both significantly above the 100-day and 200-day curves. However, the weight of evidence reveals a split narrative: momentum indicators like MACD are beginning to roll over while volume accumulation remains positive. The Zcash crypto price sits at a technical crossroads where bulls are pushing against upper resistance, yet emerging signals suggest caution before any aggressive continuation trade.
RSI: Neutral momentum despite elevated reading
The Zcash ZEC price analysis and chart shows an RSI reading of 62.1, which sits firmly in the bullish zone above the 50 midpoint but stops short of entering true overbought territory above 70. This suggests buyers remain in control without yet reaching extreme exhaustion levels. The momentum is positive but not stretched, leaving room for further upside before a mean-reversion pullback becomes likely.
Score: 7 / 10 | Bullish
Moving Averages: Why is Zcash (ZEC) price rising with such clean structure
All four major exponential moving averages are stacked in perfect bullish order: the 20-day EMA at $1,004.86 sits above the 50-day at $813.50, which sits above the 100-day at $665.96, and all three sit comfortably above the 200-day EMA at $485.67. The Zcash price benefits from this alignment, with each successive longer-term average sloping upward and providing dynamic support. Price trading above all four EMAs confirms the dominant uptrend and supports a long-term bullish macro thesis, reinforcing why this could be considered part of a broader Zcash price prediction 2030 framework where structural strength matters more than daily noise.
Score: 9 / 10 | Bullish
Bollinger Bands: Upper band signal flashing caution
The Zcash ZEC price sits at $1,134.54 between the Bollinger Band upper boundary of $1,309.2 and the middle band at $997.68, placing it in the upper half of the volatility envelope. With price roughly 89% of the way from the middle band to the upper band, volatility is being stretched but not yet maxed out. This positioning suggests the move still has runway if buying pressure persists, though the proximity to the upper extreme increases the statistical probability of mean reversion in the near term.
Score: 6 / 10 | Bullish
Fibonacci Retracements: Price finds support in the key zone
Measuring from the swing low of $361.48 to the swing high of $1,295.83, the Zcash price currently sits above the 0.618 Fibonacci level at $938.91 and below the 0.786 level at $1,095.88, placing it in a structurally significant zone. The Zcash price prediction 2026 benefits from this positioning within the upper portion of the retracement ladder, where buyers typically make their stand during corrective phases. The density of Fibonacci support beneath current levels, combined with the 0.5 level at $828.65 acting as a major structural anchor, reinforces the technical integrity of the broader uptrend.
Score: 9 / 10 | Bullish
Support Levels: Proximity concerns and structural weakening
The nearest support level lies at $1,054.58, approximately $80 below the current Zcash ZEC price of $1,134.54, representing just a 7% margin of safety. Secondary support sits further down at $788.49, a much larger gap that creates a zone of relative vulnerability between the first and second lines of defense. The weakening support score of 4.5 reflects that price is far from comfortable cushions, and a sharp pullback could quickly extend below the nearest level if selling pressure intensifies.
Score: 4.5 / 10 | Neutral
Resistance: Tight overhead supply blocking the rally
Resistance is stacked tightly at $1,257.14 and the swing high of $1,295.83, creating only $123 of headroom from the current Zcash price of $1,134.54. The narrow band between these two levels forms a congestion zone that must be broken decisively for the next leg higher to convince. The resistance score of 7 reflects that while these levels are formidable, they are not insurmountable, especially given the strong EMA alignment beneath current price supporting any breakout attempt.
Score: 7 / 10 | Bullish
Trendline: Price dipping beneath the ascending structure
The dominant ascending trendline sits at $1,189.77, which currently sits $55 above the present Zcash ZEC price of $1,134.54, meaning price is now trading below this key support line. This breakdown is concerning because the ascending trendline has acted as a guardrail during prior rallies, and slipping beneath it suggests the uptrend may be losing structural integrity. The trendline score of 4 reflects this deterioration, signaling that while price may still be higher than it was, the method of advance is becoming less orderly.
Score: 4 / 10 | Bearish
MACD: Momentum rolling over and warning of exhaustion
The MACD line stands at 123.6396 while the signal line is higher at 129.0822, creating a negative histogram of -5.4425 where the line is now below its signal, the first sign of momentum weakening. This bearish crossover setup, where the fast line falls beneath the slow line, historically precedes pullbacks and consolidation phases in uptrending markets. The MACD score of 4 confirms this is the weakest technical component, suggesting that while price has rallied, the underlying momentum driving that rally is beginning to fizzle.
Score: 4 / 10 | Bearish
On-Balance Volume: Accumulation confirms the uptrend thesis
On-Balance Volume is displaying a rising trend, indicating that buyers are accumulating Zcash across this advance and that volume is flowing into rallies rather than into selloffs. This accumulation pattern reinforces the bullish narrative suggested by the strong EMA structure and suggests institutional or sophisticated accumulation may be supporting the move. The rising OBV score of 7 means volume is backing the rally, which provides confidence that any breakout above resistance would be on legitimate buying pressure rather than thin air.
Score: 7 / 10 | Bullish
Chart Patterns: No clear pattern but structure is sound
No obvious chart pattern like a head-and-shoulders, triangle, or flag is visible in the current structure, leaving no measured target to guide profit-taking. The lack of pattern clarity is neither bullish nor bearish on its own; it simply means traders cannot rely on classical pattern geometry for guidance. However, the clean EMA structure and Fibonacci alignment provide alternative technical guardrails in the absence of a defined pattern, keeping the neutral score at 5.
Score: 5 / 10 | Neutral
Indicator | Reading | Score / 10 |
|---|---|---|
RSI (14) | Bullish zone, not overbought | 7 |
EMAs (20 / 50 / 100 / 200) | Perfect bullish stack alignment | 9 |
Bollinger Bands | Upper half of range, stretched but not maxed | 6 |
Fibonacci | Strong support at 0.618 level | 9 |
Support | Weak, only $80 to first level | 4.5 |
Resistance | Stacked, $123 overhead | 7 |
Trendline | Price below ascending line | 4 |
MACD | Bearish crossover, histogram negative | 4 |
On-Balance Volume | Rising accumulation trend | 7 |
Chart Patterns | No clear pattern identified | 5 |
Cumulative Average | BULLISH bias: I'm going long | 6.3 |
I'm going long here because the cumulative score of 6.3 out of 10 leans bullish, and more importantly, the stack of moving averages is nearly perfect with price holding above all four key EMAs while on-balance volume confirms accumulation. My entry is in the zone between $1,134.54 and $1,054.58 where I can buy dips into the nearest support level. I'm willing to buy Zcash crypto here because the structure suggests upside toward resistance, even though MACD is rolling over, giving me a defined level to exit if the thesis breaks down. I'm risking to the close below $1,054.58 as my hard stop where I would admit the reversal is real.
My entry zone | $1,054.58 – $1,134.54 |
My stop loss | $1,035.00 (close below nearest support with volume) |
My target 1 | $1,257.14: first resistance zone |
My target 2 | $1,295.83: swing high |
My target 3 | $1,360.00: extended breakout target |
Risk : Reward | 1 : 2.1 (T1) / 1 : 3.2 (T2) |
Position | Long / leveraged long |
I would exit my long position immediately if Zcash price closes below $1,054.58 on elevated volume, as this level represents the first meaningful support cushion and a break below it would suggest the uptrend is failing structurally. My thesis is wrong if the Zcash ZEC price falls back below the 200-day EMA at $485.67 after a sustained close below $1,054.58, which would confirm that the move was a bounce within a larger downtrend rather than a new upleg. I would also reverse to short if price breaks below the ascending trendline at $1,189.77 and cannot recapture it within two days, as the trendline is supposed to be the structural floor. Is Zcash a good long-term investment if the current setup breaks down? I would answer no, and I'd be raising cash rather than holding, waiting for clearer signs of accumulation at much lower levels before re-entering.
Disclaimer: This article is produced for informational and educational purposes only and does not constitute financial or investment advice. Cryptocurrency markets are highly volatile and carry significant risk. Always conduct your own research and consult a qualified financial adviser before making any trading decisions.

Bearish signals stack up across the board as SUI struggles to hold ground near key support.
 SUI
SUI
One chart signal just flipped bullish. The crowd hasn't noticed yet.
 TRX
TRX
Solana's at a crossroads with mixed signals and no clear direction in sight.
 SOL
SOL
