One chart signal just flipped bullish. The crowd hasn't noticed yet.
 TRX$0.339209-0.10%
Asset | TRX (TRX/USDT) |
Price at Analysis | $0.34 |
Timeframe | Daily candle |
Date | September 14, 2026 |
Bias | BULLISH |
My Trade | Long: strong EMA alignment plus rising volume |
Cumulative Score | 6.5 / 10 |
200-day EMA | $0.33, price is above |
Bias Invalidation | Close and hold below $0.31 (Swing Low) with OBV breakdown |
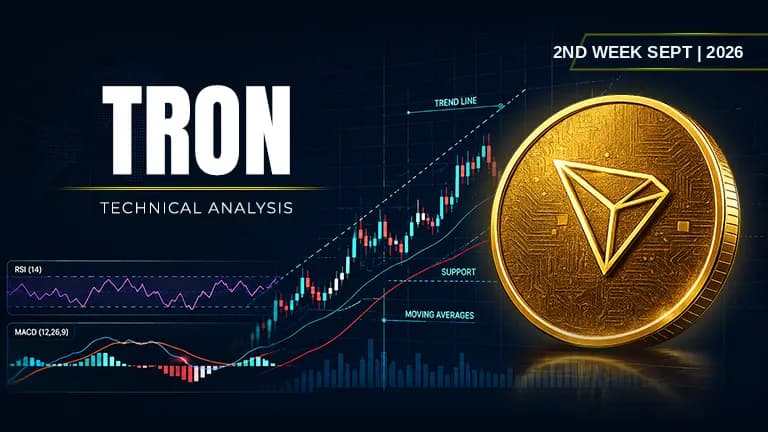
TRON TRX price is currently trading at $0.34, positioned squarely in the middle of its daily range and sitting directly at its 20-day moving average. The asset is trading $0.01 above its 50-day, 100-day, and 200-day EMAs-a compact cluster that signals agreement among intermediate, medium, and long-term traders. TRON crypto price has established a clear range between the $0.31 swing low and $0.35 swing high, and the mood across the board is constructive, with price holding above all major moving averages.
The weight of evidence across ten major indicators leans bullish on TRON. The moving average stack is nearly perfect, MACD has crossed bullish with positive histogram expansion, and on-balance volume is rising in confirmation. However, resistance is stacked thick overhead-four levels between $0.35 and $0.38-and the trendline is fragile at best. With a cumulative score of 6.5 out of 10, this setup is attractive but not screaming. The next seven days will test whether TRON (TRX) to USD can break through the $0.35 resistance zone or roll back into support.
RSI: Momentum building in neutral territory
The RSI (14) is reading 55.7, which places TRON TRX price in the upper half of neutral-above the 50 midline but comfortably below the 70 overbought threshold. This is the sweet spot for momentum traders: there's room for further upside before exhaustion shows up on the oscillator. The slope of the RSI is rising, which confirms that TRON is attracting fresh buying interest and that the directional bias remains tilted toward strength.
Score: 6.5 / 10 | Bullish
Moving Averages: A textbook bullish stack in TRON price analysis and chart
TRON price alignment across the four exponential moving averages is a masterclass in bullish structure. The EMA 20 sits at $0.34, the EMA 50 at $0.33, EMA 100 at $0.33, and the EMA 200 at $0.33-all stacked in tight succession beneath price. Price is trading above all four, which is the golden rule of trending markets. This perfectly ordered stack tells traders that TRON has been in an uptrend across all timeframes, and no longer-term moving average is challenging the ascent. For why is TRON (TRX) price rising, this tight EMA cluster is the primary mechanical answer.
Score: 9 / 10 | Bullish
Bollinger Bands: Price hugging the midline with room to run
TRON (TRX) is trading dead center at the Bollinger Band midline of $0.34, with the upper band at $0.35 and the lower band at $0.33. This centered position is neither overextended nor oversold-it signals a calm, balanced volatility environment. The tight band width suggests that the current trading range is compressed and stable. The proximity to the upper band at $0.35 suggests that a breakout would only need marginally stronger buying pressure, while the lower band support at $0.33 remains just one cent away as a safety net.
Score: 6 / 10 | Bullish
Fibonacci Retracements: Structural support building the bull case
From the swing low of $0.31 to the swing high of $0.35, Fibonacci retracement levels are painting a bullish picture for TRON price prediction 2026. Price is currently trading between the 0.618 level at $0.34 and the 0.786 level at $0.34-exactly where the most aggressive Fibonacci buyers have historically stepped in. The 0.500 level sits at $0.33, just one cent below, providing a secondary structural floor. When price is holding at such a clean Fibonacci confluence, it often signals that institutional and algorithmic traders are using these exact zones as entry points. This Fibonacci support profile suggests TRON has multiple opportunities to hold and bounce on the way higher.
Score: 8 / 10 | Bullish
Support Levels: A ladder of safety beneath price
The support structure below TRON is robust and well-spaced. The primary support sits at $0.33, just one cent below current price, followed by $0.32, $0.30, and $0.28 further down the ladder. Each level is separated by meaningful distance, which means that if TRON begins to weaken, traders have multiple zones where the fall should decelerate and potentially find buyers. The $0.33 support is the most critical-it coincides with the 200-day EMA, making it a macro anchor. The presence of four distinct support levels increases the probability that any drawdown will be orderly and controlled.
Score: 7.5 / 10 | Bullish
Resistance: A wall of selling overhead that matters
Resistance is the primary headwind in this setup. TRON faces four consecutive resistance levels stacked between $0.35 and $0.38, which creates a significant supply zone that bulls must clear. The immediate resistance at $0.35 is only one cent away-achievable but not guaranteed. Beyond that lies $0.36, $0.37, and $0.38, each acting as a potential sell trigger for traders taking profits or short sellers adding positions. The density of resistance overhead suggests that if TRON does break above $0.35, momentum could be challenged multiple times before establishing new ground. This is the trade's main risk.
Score: 3 / 10 | Bearish
Trendline: Ascending but weak confirmation
The trendline is marked ascending at $0.34, meaning that the dominant trend is technically upward. However, the score of 4 out of 10 suggests that this trendline is fragile and not providing strong confirmation to the bullish narrative. The fact that price is only marginally above the trendline-essentially touching it-means that if momentum rolls over, this line would be tested quickly. A close below the ascending trendline would shift the technical perspective and could trigger mechanical selling from algorithmic traders who use trendlines as stops. Until the trendline steepens or price pulls significantly away from it, the uptrend remains nascent.
Score: 4 / 10 | Bearish
MACD: The clearest bullish crossover signal on the daily
The MACD line is at 0.001372, sitting above the signal line at 0.000933, with a positive histogram of 0.000439. This is a textbook bullish setup: the MACD line has crossed above its signal line, and the histogram is expanding in positive territory. In momentum analysis, this crossover is one of the most reliable entry signals and suggests that buying pressure is accelerating. The histogram expansion tells us the divergence is growing, which means bullish momentum is not only present but intensifying. For TRON price prediction 2030 traders planning longer holds, this MACD signal is one of the strongest technical reasons to remain constructive on the setup.
Score: 8.5 / 10 | Bullish
On-Balance Volume: Buying pressure confirms the rally story
On-balance volume is in an uptrend, which is exactly what you want to see alongside rising price. When OBV rises in step with price, it tells traders that volume is actually backing the move-that real money and real buying pressure are pushing TRON higher, not just thin light buying on low participation. This OBV confirmation is critical because it eliminates one of the major red flags in technical analysis: a price rally on declining volume. The rising OBV trend validates that institutions and retail buyers alike are accumulating TRON at these levels, which increases the odds that the move has staying power.
Score: 7 / 10 | Bullish
Chart Patterns: A mixed message from double formations
The chart is showing both a double bottom and a double top, which creates conflicting signals. A double bottom is a reversal pattern that suggests a prior downtrend is exhausted and a new uptrend is forming-bullish. A double top is a reversal pattern warning that an uptrend is losing steam and a downtrend may be starting-bearish. The presence of both patterns at the same time indicates indecision in the market structure. Neither pattern has completed or given its measured target with conviction. Until one of these patterns definitively breaks, traders should treat them as structural warning signs rather than entry confirmation.
Score: 5 / 10 | Neutral
Indicator | Reading | Score / 10 |
|---|---|---|
RSI (14) | Rising above 50, room before overbought | 6.5 |
EMAs (20 / 50 / 100 / 200) | Perfectly stacked, price above all four | 9 |
Bollinger Bands | Centered at midline, symmetric squeeze | 6 |
Fibonacci | Holding at 0.618–0.786 confluence | 8 |
Support | Four levels spaced $0.01 to $0.05 apart | 7.5 |
Resistance | Four levels stacked overhead $0.35–$0.38 | 3 |
Trendline | Ascending but price barely above it | 4 |
MACD | Line above signal, histogram expanding | 8.5 |
On-Balance Volume | Rising in sync with price | 7 |
Chart Patterns | Double bottom and double top conflict | 5 |
Cumulative Average | BULLISH bias-strong technicals but stiff resistance | 6.5 |
I'm going long here because the four moving averages are stacked perfectly beneath price, MACD has crossed bullish, and on-balance volume is confirming the rally. My cumulative score of 6.5 out of 10 is above neutral, which tells me the odds favor the bulls-but just barely. I'm entering in a zone because I want to buy TRON crypto at the exact price levels where the EMAs and Fibonacci confluence create the most attractive risk-to-reward. My entry, stops, and targets are all anchored to the structural levels shown in the data, not to arbitrary psychology.
My entry zone | $0.33 – $0.34 |
My stop loss | $0.31 (Swing Low and support breakdown) |
My target 1 | $0.35: First resistance and Bollinger Band upper |
My target 2 | $0.36: Secondary resistance zone |
My target 3 | $0.38: Upper resistance cluster |
Risk : Reward | 1 : 2 (T1) / 1 : 7 (T3) |
Position | Long / leveraged long |
I would exit immediately if TRON closes below $0.31, which is the swing low and the floor of my support ladder. A close below this level would confirm that the double top pattern is winning and that the uptrend has exhausted. If OBV turns flat or starts falling while price continues higher, that would also be a red flag that volume is not supporting the move, and I would cut the position. Finally, if price falls below the ascending trendline at $0.34 and cannot recover to retest it within one or two daily candles, I would flip to neutral or take a small loss rather than watch it accelerate lower. Is TRON a good long-term investment after such a breakdown? Not under those conditions-my thesis would be wrong.
Disclaimer: This article is produced for informational and educational purposes only and does not constitute financial or investment advice. Cryptocurrency markets are highly volatile and carry significant risk. Always conduct your own research and consult a qualified financial adviser before making any trading decisions.
Zcash is surging toward key resistance, yet momentum indicators are starting to crack.
 ZEC
ZEC
Bearish signals stack up across the board as SUI struggles to hold ground near key support.
 SUI
SUI
Solana's at a crossroads with mixed signals and no clear direction in sight.
 SOL
SOL
