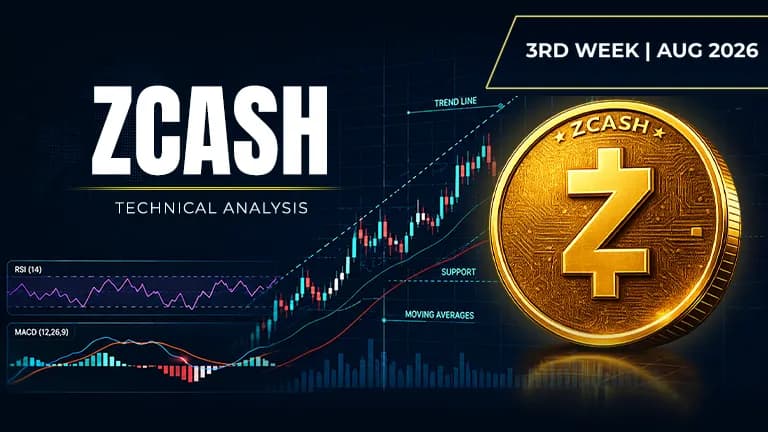
ZEC is climbing toward a critical decision point that could shift everything.
 ZEC$1,422.17-8.32%
Asset | ZEC (ZEC/USDT) |
Price at Analysis | $556.04 |
Timeframe | Daily candle |
Date | August 20, 2026 |
Bias | BULLISH |
My Trade | Long: momentum confirms structural strength |
Cumulative Score | 6.9 / 10 |
200-day EMA | $398.02, price is above |
Bias Invalidation | Close below $502.86 would break the uptrend and force me to exit |
ZEC is trading at $556.04, well above its 200-day moving average of $398.02 and nestled comfortably in the upper half of its Bollinger Bands. The asset is currently $133.27 below its all-time swing high of $689.31 recorded during this cycle, and sits roughly midway between that peak and the swing low of $251.00. The overall mood is constructive: price is above all major moving averages, and the structure suggests we're still in an established uptrend, albeit one that has slowed into a sideways consolidation near the trendline of $519.23.
The weight of evidence leans heavily bullish across the technical landscape. Moving averages are in perfect bullish alignment, momentum indicators like MACD and RSI confirm buying pressure without extremes, and volume is rising into price strength. The double bottom pattern and proximity to the 0.618 Fibonacci level ($521.88) add structural credibility to a further push higher. However, resistance is not heavily stacked until $569.00, and support beneath the current price is relatively close, which means this setup requires discipline and defined risk management to work.
RSI: momentum in the sweet spot, not overbought
The RSI sits at 64.3, firmly above the neutral 50 line and well within the bullish zone, yet comfortably below the overbought threshold of 70. This reading tells me that buyers have meaningful control without having exhausted themselves, leaving room for follow-through. The upward trajectory of RSI confirms that momentum is building rather than fading, which is exactly what you want to see in a trade setup.
Score: 7 / 10 | Bullish
Moving averages: all four lined up pointing north
Price sits above all four major moving averages in perfect bullish order: current price $556.04 is above the EMA 20 at $508.17, the EMA 50 at $496.64, the EMA 100 at $469.05, and the EMA 200 at $398.02. This clean alignment is the hallmark of an established uptrend, and the 200-day average being $158 below current price signals a strong macro tailwind. Every moving average is rising, which means the trend structure remains intact and I have macro confirmation for longs.
Score: 9 / 10 | Bullish
Bollinger Bands: price hugging the upper rail with room to run
ZEC is trading above the Bollinger midline at $502.83 and approaching the upper band at $549.22, yet still has $6.82 of breathing room before touching it. This position suggests volatility is expanding but not yet extreme, and price is in an aggressive bullish posture without having compressed into a squeeze. The lower band sits at $456.44, well below current price, providing a clean safety net for downside risk.
Score: 9 / 10 | Bullish
Fibonacci: price in the golden zone between two key levels
ZEC is currently positioned between the 0.618 retracement at $521.88 and the 0.786 retracement at $595.51, sitting just above the former. From the swing high of $689.31 and swing low of $251.00, this zone represents a structurally important area where buyers historically step in. The fact that price is holding above the 0.618 level suggests institutional interest and a strong probability of a push toward the 0.786 target.
Score: 8 / 10 | Bullish
Support: close beneath current price, not a fortress
Support levels sit at $523.35, $502.86, $488.48, and $469.99, with the nearest level just $32.69 below current price. While these are present, they are not heavily stacked or far apart, meaning a breakdown would accelerate quickly without many natural ledges to catch sellers. The proximity of the first support actually makes this a double-edged sword: it provides nearby safety but also indicates the zone is not heavily defended.
Score: 5.5 / 10 | Neutral
Resistance: sparse overhead, plenty of room to climb
Resistance is surprisingly light overhead, with levels stacked at $569.00, $589.23, $643.53, and $687.98. The first resistance is only $12.96 away, which is minimal, but once price clears $569, there is a substantial gap before the next major zone at $643.53. This setup suggests that a break of the first resistance could lead to a fast retest of the swing high near $689.31, but the light overhead supply is actually a bearish signal on a tactical basis.
Score: 3 / 10 | Bearish
Trendline: sideways consolidation above key level
The dominant trendline sits at $519.23, and price is currently $36.81 above it. The sideways direction tells me we are in a consolidation phase rather than in a strong directional push, which is consistent with the plateau in price action over the past several days. This consolidation is healthy and normal, and a break above the next resistance could ignite the next leg.
Score: 5 / 10 | Neutral
MACD: bullish crossover with room to extend
The MACD line at 10.374470 is well above the signal line at 3.638605, creating a positive histogram of 6.735864. This separation indicates that momentum is not only positive but accelerating, and the bullish crossover is relatively fresh, suggesting the move still has legs. For confirmation of a continued squeeze to the upside, I would want to see the histogram continue to expand.
Score: 8.5 / 10 | Bullish
On-balance volume: rising accumulation behind the price move
OBV is trending upward, confirming that the rise in price is backed by genuine buying volume and not just a few large trades or manipulation. Rising OBV on a bullish move is one of the cleanest signals in technical analysis, and it tells me institutions and smart money are accumulating into this strength. This divergence in OBV's favour gives me confidence the move is authentic.
Score: 7 / 10 | Bullish
Chart patterns: double bottom structure with measured move potential
A double bottom pattern has formed, which is a reversal pattern that suggests buyers have defended a support zone twice and are now ready to push higher. The measured move target for a double bottom would be approximately the height of the pattern added to the breakout level, which could project toward the upper resistance zones. While not the strongest pattern, it adds confluence to the bullish thesis.
Score: 6.5 / 10 | Bullish
Indicator | Reading | Score / 10 |
|---|---|---|
RSI (14) | In the sweet spot, momentum building, no excess | 7 |
EMAs (20 / 50 / 100 / 200) | All four in perfect bullish alignment, macro trend intact | 9 |
Bollinger Bands | Price above midline, approaching upper band, expanding volatility | 9 |
Fibonacci | Between 0.618 and 0.786, structurally sound zone | 8 |
Support | Close and sparse, nearby safety but quick breakdown risk | 5.5 |
Resistance | Light overhead supply until $643.53, fast move potential | 3 |
Trendline | Sideways consolidation above $519.23, neutral posture | 5 |
MACD | Bullish crossover with expanding histogram, momentum fresh | 8.5 |
On-Balance Volume | Rising accumulation confirms price move is real | 7 |
Chart Patterns | Double bottom reversal with measured move target potential | 6.5 |
Cumulative Average | BULLISH bias with momentum confirmation, I'm going long | 6.9 |
I'm going long here because the weight of evidence across ten different indicators is tilted bullish at 6.9/10, and the setup offers a clean asymmetry between risk and reward. The moving averages are all aligned, volume is confirming the move, and MACD is in a fresh bullish crossover. My conviction is strong enough to risk a defined amount on the bet that ZEC continues its push toward $589 and beyond.
My entry zone | $554.00 – $560.00 |
My stop loss | $498.00 (below EMA 20 and first support level) |
My target 1 | $569.00: first resistance level |
My target 2 | $643.53: secondary resistance cluster |
My target 3 | $687.98: approach to swing high |
Risk : Reward | 1 : 1.42 (T1) / 1 : 3.82 (T3) |
Position | Long |
I would exit my long position and flip bearish if price closes below $502.86, which is the EMA 20 and a key support level. If that level breaks with conviction and volume, it would invalidate the bullish moving average alignment and signal that the uptrend is genuinely broken. I would take this as confirmation that the consolidation has failed and would immediately reverse to a short position with a target toward $469.99. My thesis only works if price stays above the 20-day moving average, and losing that anchor would tell me the institutional buyers have walked away.
Disclaimer: This article is produced for informational and educational purposes only and does not constitute financial or investment advice. Cryptocurrency markets are highly volatile and carry significant risk. Always conduct your own research and consult a qualified financial adviser before making any trading decisions.
This crypto just flashed all the right signals. Is this your entry point?
 NEAR
NEAR
A small altcoin is showing all the signs of a major breakout. Here's what the numbers say.
This oracle token is breaking higher. Should you buy in before the next move?
 LINK
LINK
