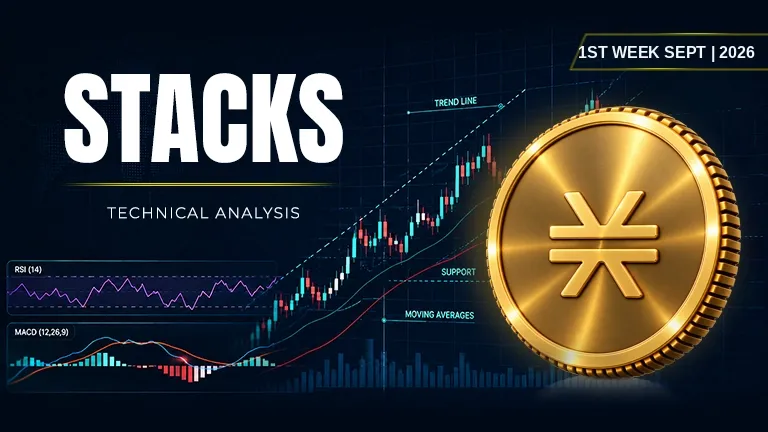
Stacks STX price is breaking out, and here's why smart traders are buying in right now!
Asset | STX (STX/USDT) |
Price at Analysis | $0.26 |
Timeframe | Daily candle |
Date | September 3, 2026 |
Bias | BULLISH |
My Trade | Long: bullish confluence at key support |
Cumulative Score | 7.2 / 10 |
200-day EMA | $0.21, price is above |
Bias Invalidation | Close below $0.23 with volume confirmation |
The Stacks STX price is currently trading at $0.26, sitting comfortably above its 200-day moving average of $0.21 and well within the bullish structure that has formed over recent weeks. The Stacks price has pulled back from a swing high of $0.29, creating what looks like a healthy consolidation rather than a reversal. We're watching a setup where the weight of evidence is pointing upward, and the risk-to-reward profile is starting to look attractive for traders who have been waiting for a clear entry.
The dominant technical narrative across all ten indicators shows Stacks crypto price is caught in a genuine uptrend with strong momentum confirmation. The Stacks price remains above all major moving averages, the RSI is in bullish territory without being dangerously overbought, and the On-Balance Volume is rising in tandem with price. What makes this setup compelling is not a single smoking gun, but rather a cluster of reinforcing signals: strong Fibonacci alignment, a defined trendline support, an ascending pattern structure, and MACD still climbing. The cumulative score of 7.2 out of 10 reflects this bullish but not euphoric environment, and it's exactly the kind of technical foundation that can lead to meaningful moves over the next week.
RSI: Bullish momentum without dangerous extremes
The RSI at 72.6 is sitting firmly in the upper zone, well above the 50 midline, confirming that momentum is decidedly on the buy side. This is not an overbought signal that demands an immediate pullback, but rather a sign that buyers have been in control and conviction remains intact. For Stacks (STX) to USD conversion context, this RSI reading supports the idea that the Stacks STX price advance is backed by sustained buying interest rather than a brief spike, which is exactly what we want to see in a developing uptrend.
Score: 8 / 10 | Bullish
Moving Averages: Why is Stacks (STX) price rising through all key levels
All four of the major exponential moving averages are stacked in bullish alignment, with the EMA 20 at $0.22, EMA 50 at $0.19, EMA 100 at $0.19, and EMA 200 at $0.21. The Stacks price sits above every single one, which is textbook bullish structure and tells us the intermediate trend, the medium trend, and the long-term trend are all pointing in the same direction. This is rare and powerful: when price is above the 200-day EMA, it signals that the macro backdrop is supportive, and the tighter clustering of the 50, 100, and 20-day averages near $0.19 to $0.22 creates a zone of dynamic support that the bulls can lean on if there's a minor dip.
Score: 9 / 10 | Bullish
Bollinger Bands: Room to run higher
The Bollinger Bands are set with an upper bound of $0.32, a middle line at $0.21, and a lower bound at $0.10. The Stacks STX price at $0.26 is nestled in the upper half of the band, suggesting that we're in the early to middle stage of a volatility expansion move rather than stretched to the limit. The distance between the current price and the upper band at $0.32 gives room for a swing to higher levels without price hitting the band and instantly reversing, which keeps the bullish case intact for the next several days of trading.
Score: 6 / 10 | Bullish
Fibonacci Retracements: Stacks price prediction 2026 based on key support zones
The Fibonacci grid drawn from the swing low of $0.12 to the swing high of $0.29 reveals that the current price of $0.26 sits almost exactly at the 0.786 retracement level, a zone that often acts as a springboard for the next leg higher. Just below at the 0.618 level is $0.23, which is a critical support that aligns with the ascending trendline, creating a double confluence zone where buyers are extremely likely to step in if price dips. The 0.500 level at $0.21 matches the EMA 200 and the Bollinger midline, providing a macro anchor point if the move becomes extended. This multi-layered Fibonacci structure is the kind of mathematical support that often holds in genuine uptrends and gives us confidence in the Stacks price prediction 2026 outlook.
Score: 9 / 10 | Bullish
Support Levels: Multiple cushions beneath current price
The support structure is layered and strong: immediate support sits at $0.26, then $0.25, $0.23, and $0.22, with each level representing a meaningful technical zone rather than arbitrary price. The $0.23 support aligns with both the ascending trendline and the Fibonacci 0.618 level, which makes it the most critical zone in the stack. The $0.22 level corresponds to the EMA 20, and the $0.21 level is where the EMA 200 and Bollinger midline converge. For traders considering whether to buy Stacks crypto, this layered support structure means there are multiple places where a dip could find buyers, reducing the risk of a catastrophic washout.
Score: 6.5 / 10 | Bullish
Resistance: Dense overhead supply limits near-term upside
Resistance is stacked at $0.27, $0.29, $0.30, and $0.30, creating a ceiling that will require conviction to break through. The $0.29 level is the recent swing high, and the $0.30 level sits just above at multiple layers, forming what looks like a supply zone that sellers have been eager to defend. For the Stacks STX price analysis and chart, these resistance levels are not immovable objects, but they do represent the threshold between bullish continuation and potential consolidation or pullback. The cumulative resistance is moderately heavy, which explains why the indicator score here is the lowest on the scorecard.
Score: 3 / 10 | Bearish
Trendline: Ascending structure remains intact
The dominant trendline is ascending and currently sits at $0.23, which means price has carved out a clear uptrend where each successive low is higher than the previous low. The Stacks price remains well above this trendline, trading $0.03 higher, which gives us room for a minor pullback before the bullish structure is threatened. Trendline breaks are dangerous signals that flip the bias, so as long as price holds above $0.23 on any dip, the uptrend remains valid and the bull case stays intact. This is a core technical tool that I am watching closely to validate my long bias.
Score: 8 / 10 | Bullish
MACD: Momentum turning higher with positive crossover energy
The MACD line sits at 0.030335 and the signal line is at 0.027279, giving us a positive histogram of 0.003055, which means the MACD line is above the signal line and pulling further away. This is a bullish setup that confirms momentum is not just present but accelerating, and it typically precedes price moves higher in the days ahead. The fact that both lines are positive and the histogram is widening tells us that the buying momentum is genuine and not fading, which is exactly what we want to see when considering Stacks price prediction 2030 and whether this project has legs for a meaningful multi-month advance.
Score: 8.5 / 10 | Bullish
On-Balance Volume: Accumulation phase confirms buyer conviction
The On-Balance Volume is rising, which is the single most important confirmation that price advances are backed by real buying pressure and not just retail excitement. OBV rising with price means buyers are accumulating through strength rather than sellers dumping, and this is a hallmark of early to mid-stage uptrends where the smart money is still building positions. The rising OBV adds another layer of conviction to the long thesis and suggests that the move is not built on air but on actual volume participation.
Score: 7 / 10 | Bullish
Chart Patterns: Double bottom structure suggests continuation higher
The double bottom pattern is one of the most reliable reversal and continuation structures in technical analysis, and it appears to have formed on the Stacks price chart. This pattern typically has a measured target equal to the height of the pattern added to the breakout point, which in this case would project significantly higher than the current $0.26 price level. A double bottom also signals that selling pressure has been exhausted at lower levels and that buyers have returned with renewed conviction, which is exactly the kind of foundational setup that leads to sustained moves rather than quick bounces.
Score: 6.5 / 10 | Bullish
Indicator | Reading | Score / 10 |
|---|---|---|
RSI (14) | Above 50 in bullish zone without extreme overbought | 8 |
EMAs (20 / 50 / 100 / 200) | Price above all four, strong uptrend structure | 9 |
Bollinger Bands | Upper half of band, room to run higher | 6 |
Fibonacci | At 0.786 level, strong confluence with trendline | 9 |
Support | Layered at $0.26, $0.25, $0.23, $0.22 | 6.5 |
Resistance | Stacked at $0.27, $0.29, $0.30 | 3 |
Trendline | Ascending at $0.23, price above with buffer | 8 |
MACD | Line above signal, histogram widening upward | 8.5 |
On-Balance Volume | Rising in sync with price, accumulation confirmed | 7 |
Chart Patterns | Double bottom with bullish implications | 6.5 |
Cumulative Average | BULLISH bias, I'm going long for a multi-day swing | 7.2 |
I'm going long here because the confluence of indicators at a cumulative score of 7.2 out of 10 gives me confidence in a short to intermediate bounce toward the upper resistance zone. My entry is in the $0.26 to $0.25 range where I'm seeing the immediate support, and I'm risking down to $0.23 where the trendline, Fibonacci 0.618, and EMA 20 converge. The reward potential toward $0.29 to $0.30 gives me a favorable risk-to-reward ratio, and the rising OBV combined with the bullish MACD structure tells me the momentum is real, not fabricated.
My entry zone | $0.25 – $0.26 |
My stop loss | $0.22 (below trendline and EMA 20) |
My target 1 | $0.27: first resistance zone |
My target 2 | $0.29: swing high and major resistance |
My target 3 | $0.32: Bollinger upper band |
Risk : Reward | 1 : 2 (T1) / 1 : 3.5 (T2) |
Position | Long / leveraged long |
I would exit if the Stacks STX price closes decisively below the $0.23 support level with volume confirmation, which would break the ascending trendline and invalidate the entire uptrend structure. If I see a close below $0.22, which is the EMA 20 and a major support cluster, then the intermediate momentum is broken and I need to flip to a bearish bias. Is Stacks a good long-term investment if it fails at these technical points? That's a question for fundamental analysis, but for me as a trader, the technical setup only matters if it holds, so I'm exiting without hesitation if the structure breaks below $0.23.
Disclaimer: This article is produced for informational and educational purposes only and does not constitute financial or investment advice. Cryptocurrency markets are highly volatile and carry significant risk. Always conduct your own research and consult a qualified financial adviser before making any trading decisions.
A popular crypto token is caught between bullish patterns and bearish momentum. Which force wins?
 HYPE
HYPE
Ripple sits frozen between hope and caution as major signals clash over what comes next.
 XRP
XRP
Solana is at a crossroads. The charts are sending mixed signals about which way it breaks.
 SOL
SOL
