A coin caught between bulls and bears. One move will decide everything.
 VIRTUAL$0.695247+6.56%
Asset | VIRTUAL (VIRTUAL/USDT) |
Price at Analysis | $0.69 |
Timeframe | Daily candle |
Date | September 3, 2026 |
Bias | NEUTRAL |
My Trade | Neutral: mixed signals warrant caution |
Cumulative Score | 5.4 / 10 |
200-day EMA | $0.66, price is above |
Bias Invalidation | Close above $0.72 with volume confirms bullish break; close below $0.62 with OBV confirmation flips to bearish |
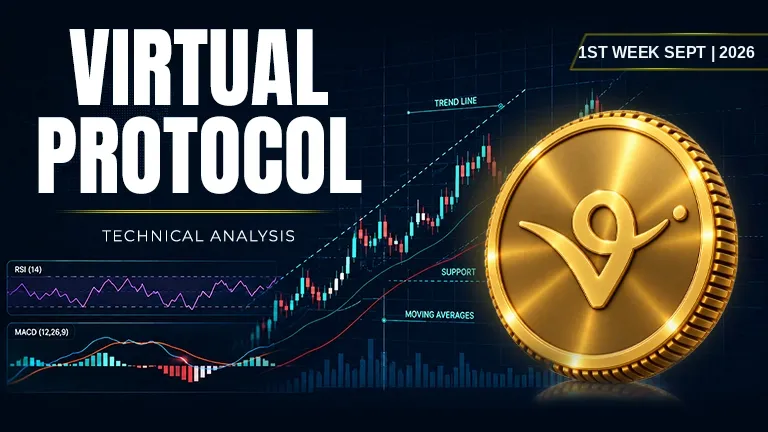
Virtuals Protocol VIRTUAL price is trading at $0.69 on the daily timeframe, sitting just above its 200-day moving average at $0.66. The asset has recovered meaningfully from its swing low of $0.50 but remains well below the swing high of $0.84, placing it in the middle of a six-month range. The overall market structure is constructive, yet momentum indicators are flashing caution signals that suggest traders should not get too excited about the current position.
Virtuals Protocol price analysis reveals a market in transition. The weight of evidence across the 10 indicators is genuinely split: moving averages are beautifully aligned and bullish, Fibonacci retracements are well-structured, and support is relatively close. However, resistance overhead is formidable and tightly stacked, on-balance volume is falling, and the MACD histogram has turned negative. With a cumulative score of just 5.4 out of 10, Virtuals Protocol crypto price action is simply telling us to wait for a clearer directional setup before committing capital.
RSI: Neither overbought nor oversold
The RSI at 54.9 is sitting right at equilibrium, neither pushing into overbought territory above 70 nor diving into oversold below 30. This neutral reading reflects a market without significant directional conviction. Momentum is present but not extreme, suggesting the next move will depend on external catalyst or technical breakout rather than pure momentum exhaustion.
Score: 6 / 10 | Bullish
Moving Averages: Virtuals Protocol price in clean uptrend structure
All four moving averages are stacked in bullish order, with price at $0.69 trading above the EMA 20 at $0.67, EMA 50 at $0.64, EMA 100 at $0.63, and notably above the EMA 200 at $0.66. This vertical alignment is textbook bull-market structure and is one of the strongest signals in the Virtuals Protocol VIRTUAL price analysis and chart today. For a Virtuals Protocol price prediction 2026, the fact that price maintains its position above the longer-term moving averages suggests the macro trend remains intact, even if short-term consolidation is underway.
Score: 9 / 10 | Bullish
Bollinger Bands: Volatility compressed toward the midline
The Bollinger Bands show price trading near the mid-band at $0.67, with an upper band at $0.81 and lower band at $0.54. This positioning indicates volatility is contracted rather than expanded, suggesting the market is coiling energy before the next directional move. Price has room to run in either direction before hitting band extremes, which historically precedes breakout moves.
Score: 6 / 10 | Bullish
Fibonacci Retracements: Price between key ratio zones
Using the swing high of $0.84 and swing low of $0.50, the current price of $0.69 is positioned between the 0.5 Fibonacci level at $0.67 and the 0.618 level at $0.71. This is a structurally significant zone where the market often pauses before deciding direction. A break above $0.71 opens the door to the 0.786 level at $0.76, while failure below $0.67 targets the 0.382 retracement at $0.63.
Score: 7 / 10 | Bullish
Support Levels: Floor is holding at key zones
Support sits at $0.67, $0.64, $0.62, and $0.60, creating a stacked floor of buyers within just $0.09 below the current price. The immediate support at $0.67 is extremely tight and has likely prevented larger sell-offs. Regarding Virtuals Protocol crypto price, these levels provide good downside protection for any trader looking to establish positions on weakness.
Score: 6.5 / 10 | Bullish
Resistance: Dense supply overhead limits upside room
Resistance is clustered at $0.70, $0.72, $0.73, and $0.75, creating a wall of sellers just $0.01 to $0.06 above the current price. This stacked resistance is the primary reason I am not more bullish on this move: there is very little breathing room before price runs into multiple layers of supply. Breaking through this zone on volume would be required to confirm a sustained rally.
Score: 3 / 10 | Bearish
Trendline: Ascending support at $0.71 provides structure
The ascending trendline sits at $0.71, offering structural support just above the current price of $0.69. Price is currently below this trendline, which is a minor red flag for continuation traders. A close below the trendline would weaken the bullish case, while a reclaim would reinforce it. Why is Virtuals Protocol (VIRTUAL) price dropping into this zone? Profit-taking and resistance overhead are the primary culprits keeping buyers hesitant.
Score: 4 / 10 | Bearish
MACD: Histogram has turned negative, momentum is fading
The MACD line is at 0.025104 and the signal line is at 0.030824, with the histogram at -0.005721, indicating the line has just crossed below the signal. This is an early warning sign that bullish momentum is beginning to fade. While the values remain positive in absolute terms, the direction of change is what matters, and the histogram's negative flip suggests the next 1-3 candles could see consolidation or minor weakness.
Score: 4 / 10 | Bearish
On-Balance Volume: Distribution pressure is evident
On-balance volume is in a falling trend, which means the volume profile is skewed toward down days. This divergence from price (which is holding relatively stable) suggests accumulation is not strong enough to support a sustained rally. The falling OBV is a red flag that suggests buyers are not all-in on this move, and sellers maintain underlying pressure.
Score: 3 / 10 | Bearish
Chart Patterns: No clear pattern limits directional conviction
With no clear chart pattern present, traders must rely on support, resistance, and moving average structure rather than pattern-based targets. This lack of pattern definition reinforces the neutral bias: the market has not yet committed to a clear setup. Absent a recognizable pattern, patience is the wisest approach until either bulls or bears take decisive control.
Score: 5 / 10 | Neutral
Indicator | Reading | Score / 10 |
|---|---|---|
RSI (14) | Neutral zone, no momentum extreme | 6 |
EMAs (20 / 50 / 100 / 200) | Perfect bullish alignment, price above all | 9 |
Bollinger Bands | Midline trade, coiled volatility | 6 |
Fibonacci | Between key ratios, structural significance | 7 |
Support | Stacked and tight, close protection | 6.5 |
Resistance | Dense overhead, limited room to run | 3 |
Trendline | Below ascending line, minor warning | 4 |
MACD | Histogram negative, momentum fading | 4 |
On-Balance Volume | Falling trend, accumulation weak | 3 |
Chart Patterns | No setup identified, awaiting clarity | 5 |
Cumulative Average | NEUTRAL bias: wait for clarity | 5.4 |
I'm staying neutral on this trade because the setup is genuinely mixed and the risk-to-reward does not favor action right now. With a cumulative score of 5.4 out of 10, the indicators are split almost exactly down the middle between bullish (moving averages, Fibonacci, support) and bearish (resistance, MACD, OBV) signals. I would not buy Virtuals Protocol crypto, neither sell Virtuals Protocol crypto at these levels because there is no conviction. Instead, I'm watching for either a close above the $0.72 resistance with volume confirmation or a breakdown below $0.62 that would give me a clear directional thesis. Until then, I am staying on the sidelines.
My entry zone | Wait for breakout above $0.72 or breakdown below $0.62 |
My stop loss | $0.60 (below second major support, invalidates the uptrend) |
My target 1 | $0.75 - Resistance cluster |
My target 2 | $0.81 - Bollinger upper band |
My target 3 | $0.84 - Swing high |
Risk : Reward | Not applicable in neutral stance |
Position | Flat / observing |
I would flip bullish if price closes above $0.72 with a volume spike that confirms buyer conviction, as this would break the resistance cluster and potentially launch toward the $0.81 upper band. Conversely, I would turn bearish if Virtuals Protocol (VIRTUAL) to USD falls below $0.62 on rising volume, which would invalidate the moving average support structure and suggest a retest of the $0.50 swing low. Regarding Is Virtuals Protocol a good long-term investment, the neutral bias means I need more clarity on whether this is a pullback to buy or the beginning of a larger correction. My exit from this neutral stance depends entirely on which technical level breaks first and whether volume confirms the move.
Disclaimer: This article is produced for informational and educational purposes only and does not constitute financial or investment advice. Cryptocurrency markets are highly volatile and carry significant risk. Always conduct your own research and consult a qualified financial adviser before making any trading decisions.
A popular crypto token is caught between bullish patterns and bearish momentum. Which force wins?
 HYPE
HYPE
Ripple sits frozen between hope and caution as major signals clash over what comes next.
 XRP
XRP
Solana is at a crossroads. The charts are sending mixed signals about which way it breaks.
 SOL
SOL
