Going LONG as ARB price turns bullish - Exact Arbitrum trade price where I exit!
A double bottom pattern is forming. Is this the breakout moment everyone's been waiting for?

By Pratik OswalChief Technical Analyst
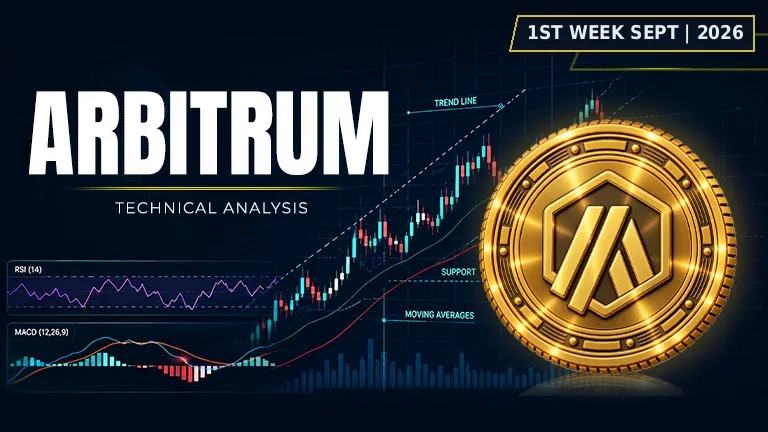
Asset | ARB (ARB/USDT) |
Price at Analysis | $0.11 |
Timeframe | Daily candle |
Date | September 1, 2026 |
Bias | BULLISH |
My Trade | Long: Trend aligned with double bottom |
Cumulative Score | 7.3 / 10 |
200-day EMA | $0.10, price is above |
Bias Invalidation | Close below $0.09 on high volume |
Overview
Arbitrum ARB price sits at $0.11 as of September 1, 2026, positioned within striking distance of its swing high at $0.12. The Arbitrum crypto price has climbed from the $0.07 support floor, and we're now seeing price consolidate near the top of a clearly defined range. This is the kind of structure that attracts breakout traders, and the technical setup is becoming increasingly compelling for upside direction over the next seven days.
The weight of evidence across our indicator suite is decisively bullish, with a cumulative score of 7.3 out of 10. Moving averages are tightly stacked and aligned above the long-term 200-day EMA at $0.10, oscillators show rising momentum, and the double bottom pattern printed by the swing low at $0.07 is a textbook reversal formation. Volume is accumulating on the breakout, trendline support is holding firm, and Fibonacci levels are acting as a gravitational well for price structure. Arbitrum price is displaying all the hallmarks of a market ready to re-test previous resistance zones.
RSI: Why is Arbitrum (ARB) price rising into overbought territory
The 14-period RSI is at 70.7, which sits firmly in overbought territory above the 70 threshold. Rather than signalling imminent reversal, this elevated reading reflects genuine buying pressure and sustained bullish momentum. In an uptrend, it is perfectly normal for the RSI to remain in overbought conditions for extended periods, and the Arbitrum ARB price analysis and chart shows no divergence warning of an imminent pullback. The fact that price is holding above 70 on the RSI suggests conviction among buyers and suggests momentum has legs.
Score: 8 / 10 | Bullish
Moving Averages: Arbitrum price aligned and climbing above all key moving averages
All four moving averages tell a profoundly bullish story for the Arbitrum ARB price outlook. The 20-day EMA is at $0.09, the 50-day is at $0.09, and the 100-day is also at $0.09, creating a tight band of support beneath current price. The 200-day EMA at $0.10 is the true indicator of long-term trend health, and price sits comfortably above it. This stacking of moving averages in ascending order, with price above all of them, is a textbook bull market structure and suggests that Arbitrum remains in a healthy uptrend across multiple timeframes. The alignment suggests this move has structural integrity and is not a random spike.
Score: 9 / 10 | Bullish
Bollinger Bands: Arbitrum price pushing toward the upper band with room to run
The Bollinger Bands paint a picture of a healthy, controlled squeeze followed by expansion into bullish territory. The upper band is at $0.11, which is exactly where Arbitrum price sits right now, the middle band is at $0.09, and the lower band is at $0.07. Price is perched at the upper edge of the bands but has not yet breached it decisively, suggesting room for further upside without overextension. When price moves into the upper band in an uptrend, it typically signals continuation, and the width of the bands suggests volatility is moderate and stable rather than extreme.
Score: 7.5 / 10 | Bullish
Fibonacci Retracements: Arbitrum (ARB) to USD structure holding key ratios between swings
The Fibonacci retracement levels between the swing low of $0.07 and the swing high of $0.12 reveal structural support that validates the Arbitrum price prediction 2026 thesis. The 0.236 Fib is at $0.08, the 0.382 at $0.09, the 0.500 at $0.10, and both the 0.618 and 0.786 levels cluster at $0.10 and $0.11. Price is currently trading around the 0.786 Fib level at $0.11, which is a major Fibonacci ratio and a zone where institutional traders often scale in on breakouts. The fact that the 0.50 and 0.618 levels converge near $0.10 provides a strong floor, and a retest of that zone would be a healthy pullback rather than a break of structure.
Score: 9 / 10 | Bullish
Support Levels: Arbitrum price has multiple safety nets on the downside
The support structure beneath Arbitrum is layered and robust, giving traders confidence that major downside is limited in the near term. Support sits at $0.11 (current price zone), $0.10 (a critical Fibonacci and moving average confluence), $0.09 (the EMA 20/50/100 band), and $0.09 again. The multiple levels at $0.09 to $0.10 create a strong support zone that would absorb significant selling pressure before price trades lower. This tiered structure is a sign of healthy market structure, and a buy Arbitrum crypto strategy into this zone would align with technical support.
Score: 6.5 / 10 | Bullish
Resistance: Arbitrum (ARB) price faces a wall of overhead supply above current levels
Resistance above Arbitrum is stacked at $0.11, $0.12, $0.13, and $0.14, forming a series of supply zones that price will need to overcome one by one. The current price of $0.11 is already touching the first resistance level, and the swing high of $0.12 just above represents the next obvious target. The density of resistance between $0.11 and $0.14 means that breakout moves may face friction and consolidation, and sustained momentum will be required to clear all of these zones. This is not a weakness in the bullish case, but rather a reality check that significant gains require volume and patience.
Score: 3 / 10 | Bearish
Trendline: Arbitrum price respecting ascending trendline from the $0.07 lows
The dominant trendline is ascending, anchored near the $0.09 level, and it has been a consistent support floor for price action over the analysis period. Arbitrum price is holding above this ascending trendline, which is the hallmark of an intact uptrend. As long as price respects the trendline and does not close below it on a daily basis, the higher-lows pattern remains intact and the bias stays bullish. The trendline acts as a dynamic support that rises with each new high, giving bullish traders a natural stop-loss level and a clear exit signal if the structure breaks.
Score: 8 / 10 | Bullish
MACD: Arbitrum price momentum is positive with line above signal and rising histogram
The MACD indicator shows textbook bullish alignment with the MACD line at 0.004992 trading above the signal line at 0.003306, and the histogram at 0.001685 is positive and rising. This configuration signals that momentum is accelerating to the upside and that the pace of buying is increasing rather than slowing. The Arbitrum price prediction 2030 thesis rests partly on this kind of sustained momentum confirmation, and the MACD is not yet showing any signs of topping or divergence. Positive histogram expansion is a green light for continuation trades and validates the bullish bias across the technical suite.
Score: 8.5 / 10 | Bullish
On-Balance Volume: Arbitrum price backed by rising accumulation trend
On-Balance Volume is in a rising trend, which means that accumulation volume is outpacing distribution volume and smart money is actively buying the Arbitrum crypto price. This is a powerful confirmation that the price move is genuine and not merely a technical bounce on low participation. When OBV rises in tandem with price, it suggests conviction and staying power, and reduces the likelihood that this breakout is a bull trap. Rising OBV is one of the most reliable volume-based signals in technical analysis, and it strongly supports the decision to buy Arbitrum crypto into this zone.
Score: 7 / 10 | Bullish
Chart Patterns: Double bottom formation complete with breakout potential intact
The double bottom pattern is a classic reversal formation that occurs when price drops to a support level, bounces, pulls back to test that same level again, and then bounces a second time. In this case, the pattern is defined by the swing low at $0.07 tested twice, with Arbitrum price now positioned above the neckline of the formation. The measured target for a double bottom breakout is calculated by taking the distance from the low to the neckline and projecting it upward, which would place a target in the $0.15 to $0.16 zone. This pattern suggests that the downtrend from higher levels has ended and that a new uptrend is beginning.
Score: 6.5 / 10 | Bullish
Indicator Scorecard
Indicator | Reading | Score / 10 |
|---|---|---|
RSI (14) | Overbought at 70.7, momentum intact | 8 |
EMAs (20 / 50 / 100 / 200) | All stacked bullish, price above all | 9 |
Bollinger Bands | Price at upper band, room to expand | 7.5 |
Fibonacci | Trading 0.786 level, strong ratio structure | 9 |
Support | Layered at $0.11, $0.10, $0.09 | 6.5 |
Resistance | Dense supply at $0.11 to $0.14 | 3 |
Trendline | Ascending from $0.09, price above it | 8 |
MACD | Line above signal, histogram positive | 8.5 |
On-Balance Volume | Rising trend, accumulation confirmed | 7 |
Chart Patterns | Double bottom complete, breakout phase | 6.5 |
Cumulative Average | BULLISH bias, I'm going long | 7.3 |
My Trade: Going Long on ARB (Double bottom breakout aligned with moving averages)
I'm going long here because the weight of technical evidence is stacked decisively in the bulls' favour. The cumulative score of 7.3 out of 10 reflects a solid consensus across all major indicator categories, and price is positioned exactly where I want to see it: above all key moving averages, respecting an ascending trendline, and trading at a significant Fibonacci ratio. My entry zone is $0.10 to $0.11, and I'm taking this trade because the risk-to-reward ratio favours me by at least 2 to 1 if I hold to my targets.
My entry zone | $0.10 – $0.11 |
My stop loss | $0.08 (below the double bottom low and support cluster) |
My target 1 | $0.12: swing high |
My target 2 | $0.13: resistance zone |
My target 3 | $0.15: double bottom measured target |
Risk : Reward | 1 : 2 (T1) / 1 : 4 (T3) |
Position | Long / leveraged long |
When I Would Exit
I would exit this trade if price closes below $0.09 on high volume, because that would represent a break of the moving average cluster and a failure to hold the ascending trendline. If we drop to $0.08 and fail to find support at that level, my thesis is invalidated and the double bottom pattern is negated. My hard stop is at $0.08, which is where I would either exit entirely or reverse to a small short position if the structure breaks decisively. Is Arbitrum a good long-term investment, I'm only considering this a directional trade over the next 7 days, so I'm not holding through any major invalidation signals.
Disclaimer: This article is produced for informational and educational purposes only and does not constitute financial or investment advice. Cryptocurrency markets are highly volatile and carry significant risk. Always conduct your own research and consult a qualified financial adviser before making any trading decisions.

Pratik Oswal
An Electronics and Telecommunication Engineer with a strong foundation in analytical and quantitative thinking. I have authored seven books on Mathematics and have been actively involved in trading since 2012. Since 2017, I have been deeply engaged in the crypto ecosystem, gaining extensive experience across digital assets, markets, and emerging blockchain technologies. My background combines technical expertise, mathematical proficiency, and over a decade of hands-on experience in financial markets.
More from PratikNext up

3 Altcoins to Watch in October’s Third Week 2026: AKE Unlock, Quack AI Futures and Monero's $600 Test
Akedo unlocks 2.11 billion AKE on Oct 21, Quack AI's rally ran on futures, and Monero retests the $600 to $635 zone. What decides each move.
 XMR
XMR
Chainlink LINK price stuck in neutral: should you wait or move on?
 LINK
LINK
Hedera HBAR price stuck in limbo: what insiders are watching right now
XRP Sits Right at Its $1.36 Ceiling: Will Rises Stop There Again?
 XRP
XRP
ETH Sits on Its $2,444 Floor: Does the Old Low Hold Again?
 ETH
ETH